Debugging Codex CLI Sessions with the OpenAI Traces Dashboard and OTLP Export
Debugging Codex CLI Sessions with the OpenAI Traces Dashboard and OTLP Export
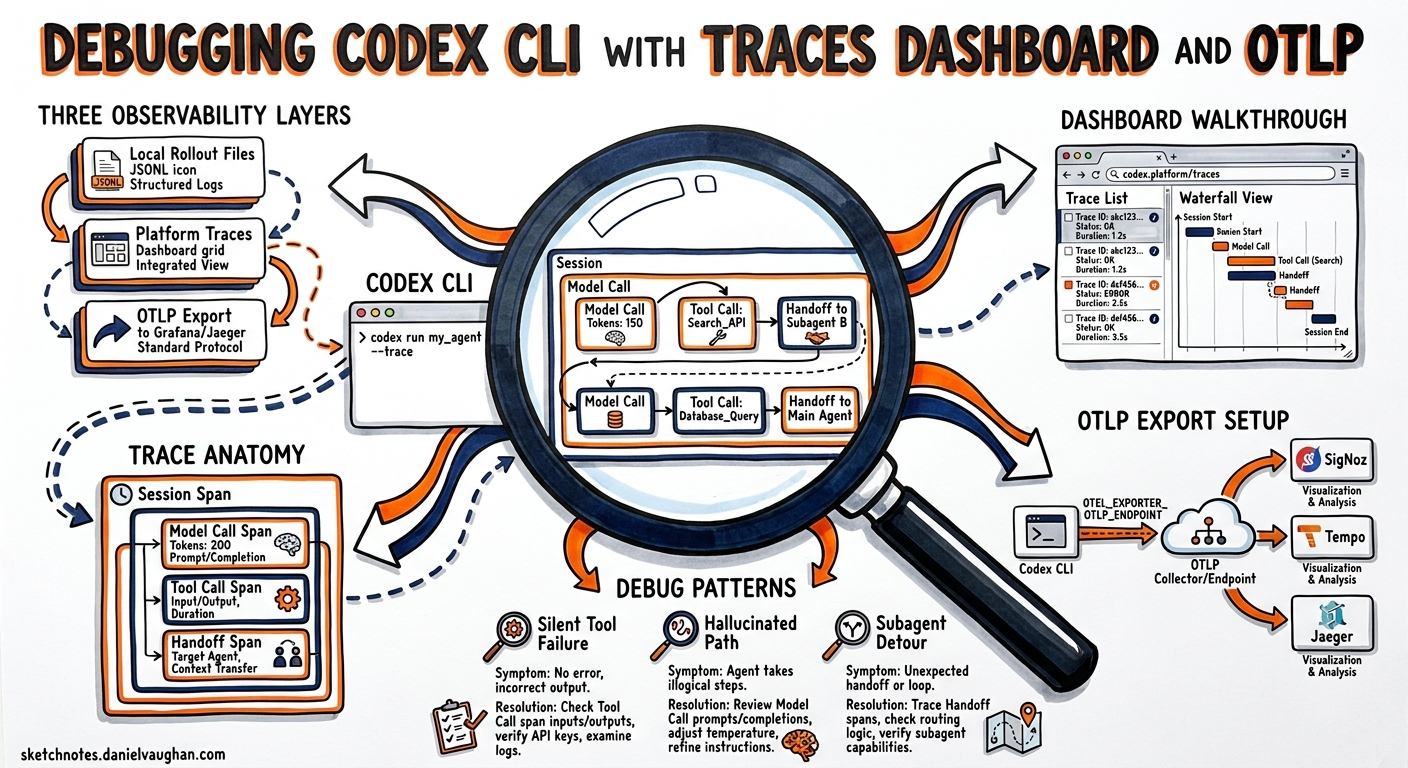
When a Codex CLI session produces unexpected results — a hallucinated file path, a tool call that silently fails, or a subagent that takes an inexplicable detour — the question is always the same: what did the agent actually decide, and why? Local rollout files provide a raw transcript, but the OpenAI Traces dashboard and OTLP-based export give you a structured, navigable view of every model call, tool invocation, and handoff that occurred during a session. This article covers the full debugging stack: the first-party platform dashboard, the rollout-trace debug reducer, and OTLP export to external backends.
The Traces Landscape for Codex CLI
Codex CLI produces observability data at three levels, each serving a different debugging need:
flowchart TD
    A[Codex CLI Session] --> B[Local Rollout Files]
    A --> C[OpenAI Platform Traces]
    A --> D[OTLP Export]
    B --> E[~/.codex/sessions/*.jsonl]
    C --> F[platform.openai.com/traces]
    D --> G[SigNoz / Grafana Tempo / Jaeger]

    style C fill:#e8f4fd
    style F fill:#e8f4fd
| Layer | What it captures | Best for |
|---|---|---|
| Local rollout files | Full append-only JSONL transcript | Audit trails, compliance, session replay |
| Platform Traces | Structured spans for model calls, tool calls, handoffs | Quick visual debugging, understanding agent decisions |
| OTLP export | OpenTelemetry spans to your own backend | Team-wide dashboards, alerting, long-term retention |
The OpenAI Platform Traces Dashboard
What Gets Captured
Since v0.125, Codex CLI’s rollout tracing records tool invocations, code-mode transitions, session relationships, and multi-agent parent-child links automatically1. When you run Codex with an API key (rather than a ChatGPT plan), these traces appear in the OpenAI platform at Logs > Traces2.
Each trace captures:
- Model calls — the prompt sent, tokens consumed (input, cached, output), reasoning effort level, and the response
- Tool calls — which tool was invoked (
shell,apply_patch,read_file, MCP tools), arguments passed, and output returned - Handoffs — when a subagent is spawned, its thread ID and relationship to the parent
- Guardrail evaluations — approval decisions, policy checks, and any hook-triggered interventions
- Timing data — wall-clock duration of each span, queue time, and token generation latency
Navigating the Dashboard
The dashboard renders each session as a tree of spans. The root span represents the full agent run, with child spans for each turn in the conversation loop2. Expanding a tool call span reveals:
- The exact arguments the model chose (e.g., the shell command or patch content)
- The tool’s stdout/stderr output
- Whether the call required approval and how it was resolved
- The duration breakdown between queue time and execution time
Filtering and Search
You can filter traces by:
- Time range — isolate sessions from a specific debugging window
- Model — compare behaviour across
gpt-5.5,gpt-5.4, orgpt-5.3-codex - Status — find traces that ended with errors or tool failures
- Session/thread ID — jump directly to a known session using the ID from
/statusorcodex resume
Privacy Controls
When using API-key mode, prompts and tool outputs are visible in the dashboard. Promptfoo’s documentation notes that Codex applies best-effort redaction to traced command text, command output, agent messages, reasoning text, MCP inputs, and MCP errors before attaching them to span attributes3. For sensitive environments, the --ephemeral flag prevents local rollout file creation, but platform traces may still be retained according to your organisation’s data retention policy4.
The Rollout-Trace Debug Reducer
For local debugging without leaving the terminal, Codex v0.125 introduced a debug reducer command that processes raw rollout traces into a condensed summary1:
codex trace reduce ~/.codex/sessions/2026/05/06/rollout-2026-05-06T09-14-22-a1b2c3d4.jsonl
The reducer outputs a structured summary showing:
Session: a1b2c3d4-...
Duration: 4m 22s | Turns: 7 | Tools: 12 calls
Model: gpt-5.4 | Reasoning: medium

Turn 1 (0:00) → shell: git status
Turn 2 (0:08) → read_file: src/auth/handler.rs (lines 1-50)
Turn 3 (0:15) → apply_patch: src/auth/handler.rs (+12 -3)
Turn 4 (0:22) → shell: cargo test auth::
  ⚠️ EXIT 1 — test auth::refresh_token FAILED
Turn 5 (0:45) → read_file: src/auth/handler.rs (lines 40-80)
Turn 6 (0:52) → apply_patch: src/auth/handler.rs (+4 -2)
Turn 7 (1:01) → shell: cargo test auth::
  ✓ EXIT 0

Token usage: 42,180 input (38,200 cached) | 3,890 output | 1,200 reasoning
This gives you at-a-glance visibility into the agent’s decision sequence without opening a browser or parsing raw JSONL.
Useful Flags
# Show only failed tool calls
codex trace reduce --failures-only <rollout-file>

# Include full tool output (verbose)
codex trace reduce --verbose <rollout-file>

# Export as JSON for programmatic processing
codex trace reduce --json <rollout-file> | jq '.turns[] | select(.exit_code != 0)'
OTLP Export Configuration
For teams that need traces in their own observability stack, Codex CLI exports OpenTelemetry spans via OTLP/gRPC5. Configuration lives in ~/.codex/config.toml:
[otel]
log_user_prompt = true
exporter = { otlp-grpc = {
  endpoint = "https://ingest.eu.signoz.cloud:443",
  headers = { "signoz-ingestion-key" = "your-key-here" }
}}
Configuration Options
| Key | Type | Default | Description |
|---|---|---|---|
log_user_prompt |
boolean | false |
Include user prompts in trace attributes |
exporter |
table | none | OTLP exporter configuration |
endpoint |
string | — | gRPC endpoint for span ingestion |
headers |
table | {} |
Authentication headers |
Self-Hosted Backends
For Jaeger, Grafana Tempo, or self-hosted SigNoz, adjust the endpoint and remove authentication headers:
[otel]
log_user_prompt = true
exporter = { otlp-grpc = {
  endpoint = "http://localhost:4317"
}}
What Spans Look Like
Each Codex session produces spans following this hierarchy:
flowchart TD
    S[codex.session] --> T1[codex.turn.1]
    S --> T2[codex.turn.2]
    S --> T3[codex.turn.3]
    T1 --> M1[codex.model_call]
    T2 --> M2[codex.model_call]
    T2 --> TC1[codex.tool.shell]
    T3 --> M3[codex.model_call]
    T3 --> TC2[codex.tool.apply_patch]
    T3 --> TC3[codex.tool.shell]
Key span attributes include:
codex.session_id— correlates with the local rollout file andcodex resumeIDcodex.model— the model used for the turn (e.g.,gpt-5.4)codex.tool.name— tool identifiercodex.tool.exit_code— for shell commandscodex.tokens.input,codex.tokens.cached_input,codex.tokens.output— per-turn token consumptioncodex.reasoning_effort— the reasoning level applied
Practical Debugging Workflows
Workflow 1: Why Did the Agent Choose the Wrong File?
- Open
platform.openai.com/tracesand filter by session ID - Expand the turn where the wrong file was edited
- Inspect the model call’s response — look at which
read_filecalls preceded theapply_patch - Check whether relevant files were in context or if the agent guessed based on naming conventions
Workflow 2: Diagnosing Slow Sessions
codex trace reduce --json <rollout-file> \
  | jq '[.turns[] | {turn: .index, tool: .tool, duration_ms: .duration_ms}] | sort_by(-.duration_ms) | .[0:5]'
This identifies the five slowest tool calls. Common culprits:
- Large
read_fileoperations pulling entire files when a range would suffice - Shell commands waiting on network (npm install, docker pull)
- Subagent spawns with high queue latency
Workflow 3: Token Spend Attribution
For teams tracking costs per task, OTLP spans carry token counts per turn. A Grafana query like:
sum by (codex.model) (
  rate(codex_tokens_output_total[5m])
)
Shows output token burn rate by model, helping teams identify sessions that would benefit from switching to gpt-5.4-mini for routine subagent work6.
Workflow 4: Multi-Agent Relationship Mapping
When using MultiAgentV2 with subagents, the platform traces dashboard shows parent-child relationships between threads. Each subagent spawn creates a child trace linked to the parent via codex.parent_session_id1. This lets you:
- Verify that subagents received the correct delegated instructions
- Identify subagents that exceeded their thread depth limit
- Correlate a subagent’s tool failures with the parent’s retry decisions
Configuration Profiles for Debugging
You can create a debug profile that enables verbose tracing without affecting your normal workflow:
[profiles.debug]
model = "gpt-5.4"

[profiles.debug.otel]
log_user_prompt = true
exporter = { otlp-grpc = { endpoint = "http://localhost:4317" }}
Then activate it per session:
codex --profile debug "Investigate the failing auth tests"
Limitations and Considerations
- ChatGPT-plan sessions do not appear in the API platform traces dashboard — you need an API key for platform-level visibility2
- MCP tool outputs are traced but may be truncated for spans exceeding 64 KB5
- Reasoning tokens are counted in spans but their content is not exposed (reasoning traces remain opaque)7
- ⚠️ The
codex trace reducecommand was introduced in v0.125 and its output format is not yet considered stable — scripts parsing its JSON output should handle schema evolution gracefully - ⚠️ OTLP export adds ~2-5% overhead to session wall-clock time due to span serialisation and network flush
Summary
The debugging story for Codex CLI has matured considerably through 2026. Rather than relying solely on raw JSONL transcripts, practitioners now have three complementary tools: the platform traces dashboard for visual exploration, the rollout-trace reducer for terminal-native debugging, and OTLP export for team-wide observability. The key insight is that traces are not just for post-mortem analysis — they are the fastest path to understanding why an agent made the choices it did, and the primary feedback loop for improving AGENTS.md instructions, skill definitions, and approval policies.
Citations
-
OpenAI, “Changelog – Codex,” v0.125.0 release notes, April 2026. Available: https://developers.openai.com/codex/changelog ↩ ↩2 ↩3
-
OpenAI, “Evaluate agent workflows,” OpenAI API Guides, 2026. Available: https://developers.openai.com/api/docs/guides/agent-evals ↩ ↩2 ↩3
-
Promptfoo, “OpenAI Codex SDK Provider,” Promptfoo Documentation, 2026. Available: https://www.promptfoo.dev/docs/providers/openai-codex-sdk/ ↩
-
OpenAI, “Command line options – Codex CLI,” OpenAI Developers, 2026. Available: https://developers.openai.com/codex/cli/reference ↩
-
SigNoz, “OpenAI Codex Observability & Monitoring with OpenTelemetry,” SigNoz Documentation, 2026. Available: https://signoz.io/docs/codex-monitoring/ ↩ ↩2
-
OpenAI, “Models – Codex,” OpenAI Developers, 2026. Available: https://developers.openai.com/codex/models ↩
-
OpenAI, “Reasoning models,” OpenAI API Guides, 2026. Available: https://developers.openai.com/api/docs/guides/reasoning ↩