Codex CLI Enterprise Observability: Choosing and Configuring Grafana Cloud, SigNoz, Dynatrace, and Opik
Codex CLI Enterprise Observability: Choosing and Configuring Grafana Cloud, SigNoz, Dynatrace, and Opik
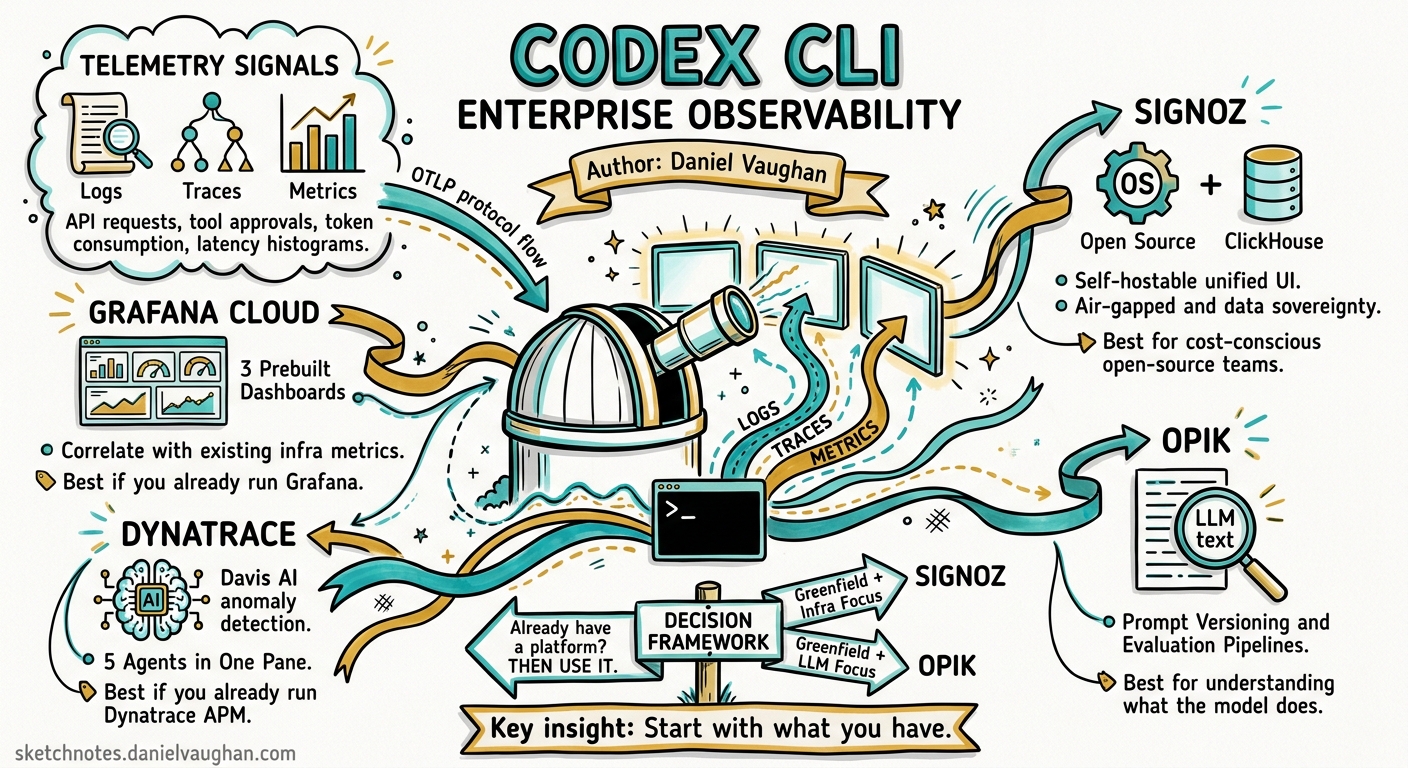
Codex CLI has shipped opt-in OpenTelemetry export since v0.107.0, but the documentation stops at “here’s how to configure an OTLP endpoint” 1. For teams running Codex across dozens of developers, the real question is: which observability platform should receive that telemetry, and what do you actually get once it arrives?
This article compares four platforms that now offer first-class Codex CLI integrations — Grafana Cloud, SigNoz, Dynatrace, and Opik — with production-ready configuration for each and a decision framework for choosing between them.
The Telemetry Codex Emits
Before choosing a backend, understand what Codex sends. The [otel] configuration block in config.toml controls three signal types 2:
| Signal | Config Key | Events / Data |
|---|---|---|
| Logs | otel.exporter |
API requests, SSE streams, tool approvals, tool results, user prompts (opt-in) |
| Traces | otel.trace_exporter |
Span-per-turn execution traces with tool invocations |
| Metrics | otel.metrics_exporter |
Token consumption, request counts, latency histograms |
Every emitted event carries metadata: service name, CLI version, environment tag, conversation ID, model name, and sandbox/approval settings 1. Events batch asynchronously and flush on shutdown.
flowchart LR
    A[Codex CLI] -->|OTLP HTTP/gRPC| B[Collector / Gateway]
    B --> C[Logs Backend]
    B --> D[Traces Backend]
    B --> E[Metrics Backend]
    C --> F[Dashboards & Alerts]
    D --> F
    E --> F
Platform Configurations
Grafana Cloud
Grafana Cloud provides a dedicated OpenAI Codex integration tile that deploys three prebuilt dashboards: Overview, Usage, and Performance 3. The integration expects three separate OTLP HTTP endpoints — one each for logs, metrics, and traces.
[otel]
environment = "production"
log_user_prompt = false

exporter = { otlp-http = {
  endpoint = "https://otlp-gateway-<region>.grafana.net/otlp/v1/logs",
  protocol = "binary",
  headers = {
    "Authorization" = "Basic ${GRAFANA_OTLP_TOKEN}"
  }
}}

metrics_exporter = { otlp-http = {
  endpoint = "https://otlp-gateway-<region>.grafana.net/otlp/v1/metrics",
  protocol = "binary",
  headers = {
    "Authorization" = "Basic ${GRAFANA_OTLP_TOKEN}"
  }
}}

trace_exporter = { otlp-http = {
  endpoint = "https://otlp-gateway-<region>.grafana.net/otlp/v1/traces",
  protocol = "binary",
  headers = {
    "Authorization" = "Basic ${GRAFANA_OTLP_TOKEN}"
  }
}}
The token is a base64-encoded <instance-id>:<access-policy-token> with write permissions for metrics, logs, and traces 3. Restart Codex after saving; data typically appears within minutes.
Strengths: Three purpose-built dashboards out of the box, strong alerting via Grafana Alerting, and the ability to correlate Codex telemetry with existing infrastructure metrics already in your Grafana stack. The open-source Grafana frontend means custom dashboards are straightforward.
SigNoz
SigNoz is an open-source, full-stack observability platform that provides logs, metrics, and traces in a single application 4. Its Codex integration uses a single gRPC endpoint.
[otel]
environment = "production"
log_user_prompt = true

exporter = { otlp-grpc = {
  endpoint = "https://ingest.<region>.signoz.cloud:443",
  headers = {
    "signoz-ingestion-key" = "${SIGNOZ_INGESTION_KEY}"
  }
}}
For self-hosted SigNoz, point the endpoint at your collector (typically http://localhost:4317) and omit the ingestion key header 4.
SigNoz renders each Codex session as a trace with nested spans. Clicking into a trace shows every tool invocation, API request, and approval decision with associated attributes 4. A community-contributed Codex dashboard template provides token-spend breakdowns and session duration distributions.
Strengths: Open-source with self-hosting option (critical for air-gapped or data-sovereignty environments), ClickHouse-backed storage with predictable pricing, and a unified interface for all three signal types without the Grafana stack assembly tax.
Dynatrace
On 30 April 2026, Dynatrace announced expanded monitoring for five coding agents including Codex CLI 5. Dynatrace ingests Codex’s native OpenTelemetry signals and layers its AI-powered analysis on top.
[otel]
environment = "production"
log_user_prompt = false

exporter = { otlp-http = {
  endpoint = "https://<environment-id>.live.dynatrace.com/api/v2/otlp/v1/logs",
  protocol = "binary",
  headers = {
    "Authorization" = "Api-Token ${DT_API_TOKEN}"
  }
}}

trace_exporter = { otlp-http = {
  endpoint = "https://<environment-id>.live.dynatrace.com/api/v2/otlp/v1/traces",
  protocol = "binary",
  headers = {
    "Authorization" = "Api-Token ${DT_API_TOKEN}"
  }
}}
The API token requires the openTelemetryTrace.ingest and logs.ingest scopes 5. Dynatrace also publishes instrumentation examples in the dynatrace-oss/dynatrace-ai-agent-instrumentation-examples repository 6.
Strengths: Davis AI anomaly detection applied to agent telemetry, unified monitoring across Codex CLI, Claude Code, Gemini CLI, and GitHub Copilot SDK in a single pane 5, and deep enterprise integration with existing Dynatrace-monitored infrastructure. If your organisation already runs Dynatrace for APM, adding Codex telemetry is a configuration change, not a platform decision.
Opik (Comet)
Opik focuses specifically on LLM observability rather than general infrastructure monitoring. Its Codex integration captures trace-level data with an emphasis on evaluation and prompt analysis 7.
[otel]
log_user_prompt = false

trace_exporter = { otlp-http = {
  endpoint = "https://www.comet.com/opik/api/v1/private/otel/v1/traces",
  protocol = "binary",
  headers = {
    "Authorization" = "${OPIK_API_KEY}",
    "Comet-Workspace" = "${OPIK_WORKSPACE}",
    "projectName" = "codex-cli"
  }
}}
For self-hosted Opik, replace the endpoint with http://localhost:5173/api/v1/private/otel/v1/traces 7.
Strengths: Purpose-built for LLM workflows with automated evaluation pipelines, prompt versioning, and experiment tracking. If your primary concern is understanding what the model does rather than infrastructure health, Opik provides the richest analytical layer.
Security Considerations
All four platforms receive potentially sensitive telemetry. Key controls:
log_user_prompt = false(default) redacts user prompts from exported logs 2. Only enable this when your data governance policy explicitly permits prompt export.- TLS configuration is available for all exporters via
tls.ca-certificate,tls.client-certificate, andtls.client-private-keykeys 2 — essential for self-hosted collectors behind corporate PKI. - Environment variable substitution (
${VAR_NAME}) in headers keeps secrets out of config files 1. - Enterprise deployments can enforce OTEL settings via
managed_config.toml, preventing individual developers from disabling telemetry or redirecting it to unapproved endpoints 8.
Decision Framework
flowchart TD
    A[Need coding agent observability] --> B{Already run an<br/>observability platform?}
    B -->|Grafana stack| C[Grafana Cloud Integration]
    B -->|Dynatrace APM| D[Dynatrace]
    B -->|Datadog| E[Use OTLP gateway ⚠️<br/>No native Codex tile yet]
    B -->|None / Greenfield| F{Primary concern?}
    F -->|Infrastructure + cost| G[SigNoz]
    F -->|LLM evaluation + prompts| H[Opik]
    F -->|Multi-agent unified view| D
| Criterion | Grafana Cloud | SigNoz | Dynatrace | Opik |
|---|---|---|---|---|
| Prebuilt Codex dashboards | ✅ 3 dashboards | ✅ Community template | ✅ AI-powered | ✅ LLM-focused |
| Self-hostable | ✅ OSS Grafana | ✅ Fully open-source | ❌ SaaS only | ✅ Self-hosted option |
| Multi-agent monitoring | ⚠️ Manual setup | ⚠️ Manual setup | ✅ 5 agents native | ❌ Codex focus |
| AI anomaly detection | ❌ Rule-based alerts | ❌ Rule-based alerts | ✅ Davis AI | ❌ |
| LLM evaluation pipelines | ❌ | ❌ | ❌ | ✅ Native |
| Air-gapped deployment | ✅ | ✅ | ❌ | ✅ |
| Pricing model | Usage-based | Open-source / Cloud | Per-host enterprise | Open-source / Cloud |
Multi-Platform Collection with an OTEL Collector
For organisations that need to send Codex telemetry to multiple backends simultaneously — say, Grafana for dashboards and Opik for LLM evaluation — deploy an OpenTelemetry Collector as a local gateway:
# config.toml — point Codex at your local collector
[otel]
environment = "production"
log_user_prompt = false
exporter = { otlp-grpc = { endpoint = "http://localhost:4317" }}
trace_exporter = { otlp-grpc = { endpoint = "http://localhost:4317" }}
Then configure the collector’s exporters and pipelines to fan out to each platform. This also centralises sampling, redaction, and header injection — keeping your config.toml clean and your secrets in the collector’s environment.
Practical Recommendations
-
Start with what you have. If your organisation already pays for Dynatrace or Grafana Cloud, add the Codex integration there. The marginal cost is near zero and you avoid a new procurement cycle.
-
Enable traces first, logs second. Traces give you session-level visibility with minimal privacy risk. Logs with
log_user_prompt = truerequire explicit data governance approval. -
Use
managed_config.tomlfor consistency. Enterprise teams should distribute OTEL configuration via managed config to ensure every developer’s CLI reports to the same endpoint with the same redaction settings 8. -
Set environment tags. Use
otel.environmentto distinguishdev,staging, andproductiontelemetry. This is especially important when the same Codex CLI binary is used across CI pipelines and interactive sessions. -
Monitor token spend as a leading indicator. All four platforms can alert on token consumption spikes — the clearest early signal that a session has entered a runaway loop or that a model change has inflated costs.
Citations
-
OpenAI, “Advanced Configuration – Codex”, https://developers.openai.com/codex/config-advanced ↩ ↩2 ↩3
-
OpenAI, “Configuration Reference – Codex”, https://developers.openai.com/codex/config-reference ↩ ↩2 ↩3
-
Grafana Labs, “OpenAI Codex Integration”, https://grafana.com/docs/grafana-cloud/monitor-infrastructure/integrations/integration-reference/integration-openai-codex/ ↩ ↩2
-
SigNoz, “OpenAI Codex Observability & Monitoring with OpenTelemetry”, https://signoz.io/docs/codex-monitoring/ ↩ ↩2 ↩3
-
Dynatrace, “Dynatrace expands AI Coding Agent monitoring for Claude Code, Google Gemini CLI, Codex CLI, OpenCode, and GitHub Copilot SDK”, https://www.dynatrace.com/news/blog/dynatrace-expands-ai-coding-agent-monitoring/ ↩ ↩2 ↩3
-
Dynatrace OSS, “AI Agent Instrumentation Examples”, https://github.com/dynatrace-oss/dynatrace-ai-agent-instrumentation-examples ↩
-
Comet, “OpenAI Codex Integration – Opik”, https://www.comet.com/docs/opik/integrations/openai-codex ↩ ↩2
-
OpenAI, “Agent approvals & security – Codex”, https://developers.openai.com/codex/agent-approvals-security ↩ ↩2