Agentic Coding in the Wild: What 95 Trillion Tokens Reveal About Codex CLI Workloads
Agentic Coding in the Wild: What 95 Trillion Tokens Reveal About Codex CLI Workloads
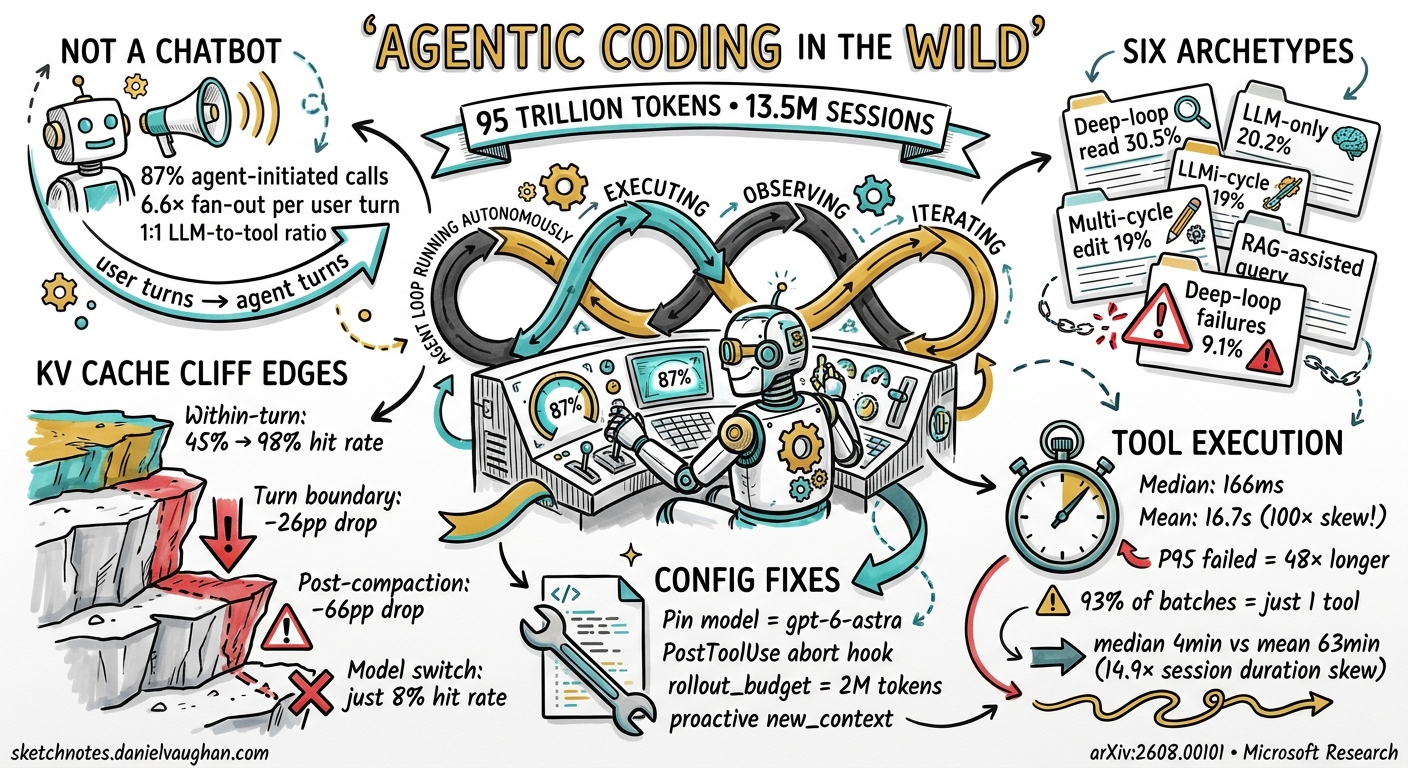
Production telemetry is rare in AI engineering. Benchmarks proliferate; real-world characterisation does not. That changed in August 2026 when Microsoft Research published a study analysing 13.5 million GitHub Copilot sessions from a single week in June 2026 — 760.5 million LLM calls, 774.7 million tool invocations, and 95 trillion tokens.1 The dataset covers 27+ models and 45+ tools. The findings challenge several assumptions baked into default Codex CLI configurations and expose three specific configuration risks that warrant immediate attention: context compaction cache wipeout, reactive model switching, and failure-driven compute amplification.
The Workload Is Not a Chatbot Workload
The canonical framing of LLM serving, a user sends a message, the model responds, does not describe agentic coding. In the production data, 87 per cent of LLM calls are agent-initiated, not user-initiated.1 A single user turn fans out into an average of 6.6 autonomous LLM calls. The observe→reason→act loop runs continuously: the session-level ratio of LLM calls to tool invocations is 40.6 versus 43.6, nearly 1:1, reflecting the canonical structure of read-context, reason about it, mutate or execute, then read again.1
Distribution is violently long-tailed. The median session has 3 turns and 15 LLM calls; the mean has 6.1 turns and 40.6 LLM calls, a 2.7× skew for calls and a 14.9× skew for session duration (4.2 minutes median versus 62.6 minutes mean).1 The tail matters for infrastructure, but the skew also matters for per-session Codex CLI configuration: a single deep-loop session can consume 1.1M prompt tokens per turn (P90 user archetype), placing it firmly in the experimental context management tier.
flowchart TD
    U["User turn (13%)"] --> |"fan-out 6.6×"| L["LLM call #1"]
    L --> T1["Tool batch"]
    T1 --> L2["LLM call #2"]
    L2 --> T2["Tool batch"]
    T2 --> Ln["LLM call n\n(87% agent-initiated)"]
    Ln --> |"next user turn"| U
    style U fill:#4a90d9,color:#fff
    style Ln fill:#4a90d9,color:#fff
KV Cache Dynamics: Three Cliff Edges
KV cache behaviour is the single most important performance characteristic of agentic coding workloads, and the data reveals three distinct cliff edges.
Within-Turn Cache Ramp-Up
The first LLM call in a turn starts cold: ~45 per cent hit rate. By call #2 it jumps to ~86 per cent, and by call #3 it plateaus at 92–94 per cent, reaching a median of 98 per cent within-turn.1 This ramp-up is invisible in single-call benchmarks but matters for short agentic loops where most of the value is in calls 2–6.
Turn-Boundary Degradation
At turn boundaries, where the user submits a new message after thinking for a median of 25.2 minutes, the same-model cache hit rate drops 26 percentage points on average, falling to 55 per cent.1 The median KV cache idle at turn boundaries is 2.9 minutes; at P95 it is 75 minutes. Any infrastructure that evicts KV cache entries after a few minutes of inactivity will cold-start the next turn, restoring the ramp-up cost across every new user prompt.
Catastrophic Compaction Events
Context compaction is the most severe disruption. It occurs in 7.8 per cent of sessions, but in those sessions it affects 44.2 per cent of total tokens, removing a median of 72.8 per cent of context.1 After compaction, the median cache hit rate drops 66.1 percentage points. In 34.3 per cent of compaction events, more than 90 per cent of the cache is erased. Compaction overhead consumes a median 22 per cent of turn execution time and P90 34 per cent.
flowchart LR
    subgraph Normal["Within-turn (no event)"]
        C1["Call 1: 45%"] --> C2["Call 2: 86%"] --> C3["Call 3+: 92-98%"]
    end
    subgraph Boundary["Turn boundary (user idle)"]
        B1["Call 1: ~55%\n(−26pp drop)"] --> B2["Call 2: 80%+"]
    end
    subgraph Compact["Post-compaction"]
        K1["Call 1: ~32%\n(−66pp drop)"]
    end
    subgraph Switch["Post-model-switch"]
        S1["Call 1: ~8%\n(−67pp drop)"]
    end
    style Compact fill:#e74c3c,color:#fff
    style Switch fill:#e74c3c,color:#fff
Model Switch: Near-Total Cache Invalidation
Model switches occur in 6.4 per cent of sessions. They are almost never planned: 36 per cent of calls before a switch have non-success status, indicating the switch is a reactive response to rate limiting or errors. The average cache hit rate after a model switch is 8 per cent — a 67-percentage-point drop from the within-turn plateau.1 The session essentially cold-starts.
Codex CLI implication: The default model picker and reactive switching logic in Codex CLI can destroy KV cache state accumulated over dozens of LLM calls. Explicitly pinning model = "gpt-6-astra" in config.toml and configuring a fallback profile that does not switch models mid-session (instead queuing or refusing) preserves cache coherence:
# ~/.codex/config.toml
model = "gpt-6-astra"

[profiles.fallback]
model = "gpt-6-astra"       # intentionally same — no cache wipe
approval_policy = "suggest"
For compaction, the v0.153.0 experimental context management feature (features.context_management.experimental_mode) introduces a new_context tool that allows the agent to checkpoint at a chosen moment with no summary, replacing context before the automatic compaction threshold is reached.2 Triggering new_context proactively, after a coherent sub-task completes, is a lower-trauma alternative to reactive compaction.
Tool Execution: The Extreme Variance Problem
Tool calls account for 28 per cent of total prompt token input (function-call messages), but their execution time distribution is almost completely bimodal.1
| Metric | Value |
|---|---|
| Median tool execution time | 166 ms |
| Mean tool execution time | 16.7 s |
| P90 tool execution time | 4.4 s |
| P99 tool execution time | 79 s |
| Mean-to-median ratio | ~100× |
Read/search tools (get_file, file search) execute in tens of milliseconds with ~100 per cent success rates. Build and terminal tools have a median of seconds and a mean of 68–78 seconds.1 Failed terminal commands at P95 take 48× longer than successful ones. The implication is that a single failed build in a deep-loop session can block the entire turn for over a minute.
Tool concurrency is lower than intuition suggests: 93 per cent of tool batches contain exactly one tool invocation; only 7 per cent dispatch multiple tools concurrently, with a median parallelism width of 2.1 Read-only tools are occasionally batched; write/execute tools are almost always serial. Critically, only 7.7 per cent of aggregate tool wall-clock time is hidden behind LLM execution — long-running tools remain fully exposed on the critical path regardless of any LLM-tool overlap optimisation.1 Infrastructure-side tool-LLM overlap (as proposed by Sutradhara3) can help at the serving layer, but from within Codex CLI the levers are timeout budgets and pre-emptive failure detection.
# config.toml — per-tool token budget caps (v0.152.0+)
[tools.run_command]
output_token_limit = 8192   # avoid runaway build output filling context

[tools.bash]
output_token_limit = 4096
PostToolUse hooks can abort immediately on non-zero exit codes, preventing the 48× latency tail from a failing tool from propagating into additional LLM calls:
#!/usr/bin/env bash
# .codex/hooks/post_tool_use.sh
# Abort the turn if a shell command returns non-zero to avoid retry amplification
if [[ "$CODEX_TOOL_NAME" == "run_command" || "$CODEX_TOOL_NAME" == "bash" ]]; then
  if [[ "$CODEX_TOOL_EXIT_CODE" -ne 0 ]]; then
    echo "Tool failed: aborting turn to prevent compute amplification" >&2
    exit 2   # signal Codex CLI to stop the current turn
  fi
fi
Six Workflow Archetypes
The paper clusters production sessions into six archetypes.1 Three have direct Codex CLI configuration implications.
pie title Session Archetype Distribution
    "Deep-loop read (30.5%)" : 30.5
    "LLM-only (20.2%)" : 20.2
    "Multi-cycle edit (19.0%)" : 19.0
    "Multi-cycle other (13.2%)" : 13.2
    "Deep-loop w/failures (9.1%)" : 9.1
    "Deep-loop run (8.1%)" : 8.1
Deep-loop with failures (9.1 per cent) is the pathological archetype: 36 LLM calls per turn, failure-driven retry loops, and compute amplification up to 4× standard load.1 These sessions consume disproportionate tokens (failed builds generate 7–8× more completion tokens than successful ones) and are the primary source of the long-tailed distribution. AGENTS.md retry budgets and PostToolUse abort hooks are the primary mitigation.
Deep-loop read (30.5 per cent) — 9 LLM calls and 7 tool batches with read-heavy patterns, is the “exploration” archetype. This is where get_file (35 per cent of all tool invocations) dominates. Context grows rapidly from conversation history (48 per cent of input) and function-call messages (28 per cent). tui.auto_recap = false combined with manual /recap invocations at exploration milestones prevents premature compaction in these sessions.2
Multi-cycle edit (19.0 per cent) — 5 LLM calls, read+edit+build, is the typical implementation loop and aligns with the highest KV cache efficiency: it is short enough to stay within the within-turn plateau and rarely triggers compaction.
The User Archetype Skew
Five user archetypes reveal a 50× resource gap between the most and least intensive users.1
| Archetype | % Users | Tools/Turn | Tokens/Turn |
|---|---|---|---|
| Readers | 41.7 per cent | 4.8 | 203K |
| Coders | 30.4 per cent | 6.2 | 417K |
| Terminal users | 11.0 per cent | 4.0 | 213K |
| Deep-loop | 9.2 per cent | 20.0 | 1.1M |
| Chat-only | 7.6 per cent | 0.0 | 23K |
Deep-loop users (9.2 per cent) consume 1.1M tokens per turn — 50× the chat-only baseline and more than 2× the coder baseline.1 This places deep-loop Codex CLI sessions squarely in the experimental context management tier and makes rollout token budget caps (rollout_budget in config.toml, v0.153.0) the primary cost-control mechanism.
# config.toml — budget guardrails for deep-loop sessions
[session]
rollout_budget = 2000000    # 2M token hard ceiling per rollout
Idle Time and Session Reconnection
Cross-turn idle dominates session wall-clock time in multi-turn sessions: user idle is the dominant activity at 80.1 per cent of total session duration (median 25.2 minutes between turns).1 The KV cache survives a median 2.9 minutes of idle; the container survives a median 4.1 minutes before eviction.
This directly motivated Codex CLI v0.153.0’s session auto-reconnect feature (PRs #41911, #41916, #41918), which preserves drafts and transcripts across app-server drops and pauses uncertain submissions on reconnection.2 The 26-percentage-point turn-boundary cache drop is infrastructure-side and outside CLI control, but reconnect stability ensures at least that context transmitted to the server is not double-sent or lost, avoiding spurious compaction events triggered by resynchronisation.
Codex CLI Configuration Checklist
Translating the production findings into actionable configuration:
| Risk | Finding | Mitigation |
|---|---|---|
| KV cache wipeout on model switch | 8 per cent hit rate post-switch (−67pp) | Pin model in config.toml; no reactive switching |
| Compaction trauma | 66.1pp cache drop, 22–34 per cent turn overhead | experimental_mode + proactive new_context |
| Failure amplification | 4× compute in deep-loop w/failures | PostToolUse abort hook (exit 2 on non-zero) |
| Context overflow in deep-loop | 1.1M tokens/turn for 9.2 per cent of users | rollout_budget cap + /recap milestones |
| Long-running tool tail latency | P95 failed commands 48× longer | output_token_limit per tool |
| Turn-boundary cache degradation | 55 per cent hit rate vs 90 per cent+ within-turn | Session reconnection stability (v0.153.0) |
The production data makes clear that Codex CLI workloads are qualitatively different from chatbot workloads, not incrementally so, but structurally. The 87 per cent agent-initiated call share, the 14.9× session duration skew, and the three compaction/switch/boundary cliff edges in KV cache efficiency all point to the same conclusion: the configurations that suit a conversation-oriented assistant will systematically under-serve a deep-loop coding agent.
Citations
-
Liu, B., Qiu, H., Goiri, Í., Fonseca, R., Bianchini, R., & Choukse, E. (2026). Agentic Coding in the Wild: Characterizing GitHub Copilot Traces at Production Scale. arXiv:2608.00101. Microsoft Research. https://arxiv.org/abs/2608.00101 ↩ ↩2 ↩3 ↩4 ↩5 ↩6 ↩7 ↩8 ↩9 ↩10 ↩11 ↩12 ↩13 ↩14 ↩15 ↩16 ↩17
-
OpenAI. (2026, September 3). Codex CLI v0.153.0 Release Notes. GitHub. https://github.com/openai/codex/releases ↩ ↩2 ↩3
-
Biswas, S. et al. (2026). Sutradhara: An Intelligent Orchestrator-Engine Co-design for Tool-based Agentic Inference. arXiv:2601.12967. Microsoft Research. https://arxiv.org/abs/2601.12967 ↩