Browser-in-the-loop testing: Playwright + Chrome DevTools MCP + Codex CLI
Browser-in-the-loop testing: Playwright + Chrome DevTools MCP + Codex CLI
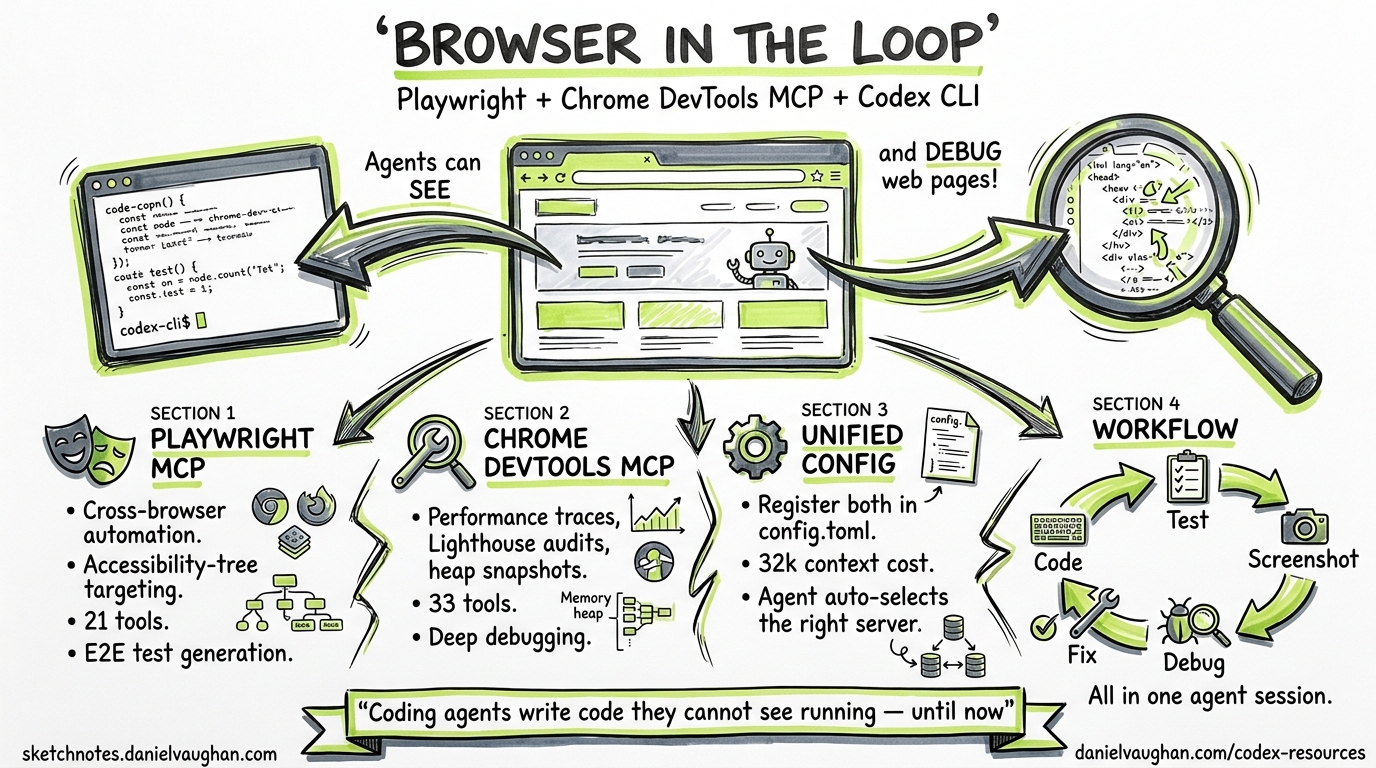
Coding agents write code they cannot see running. They generate a component, commit it, and hope the browser agrees. Browser-in-the-loop testing closes that gap by giving Codex CLI real-time access to browser state through two complementary MCP servers: Playwright MCP (v0.0.75) for driving user interactions and Chrome DevTools MCP (v0.21) for deep inspection and debugging12. Together they form a generate-drive-inspect loop that keeps the agent inside a single session from code generation through visual verification and performance audit.
Why two MCP servers?
Playwright MCP and Chrome DevTools MCP solve different problems. Playwright drives a browser; Chrome DevTools MCP debugs one3.
| Capability | Playwright MCP | Chrome DevTools MCP |
|---|---|---|
| Browser support | Chromium, Firefox, WebKit, Edge | Chrome stable only (not Chromium or Edge)4 |
| Primary strength | Cross-browser automation, accessibility-tree targeting | Performance traces, Lighthouse audits, heap snapshots, extensions |
| Network mocking | First-class via browser_route tools |
Inspection only, no mocking |
| Tool count | ~25 tools5 | 45 tools across 9 categories4 |
| Best for | Generating and running E2E tests | Diagnosing performance regressions, memory leaks, Core Web Vitals |
Chrome DevTools MCP’s 45 tools break into nine categories4:
- Input automation (10): click, drag, fill, fill_form, handle_dialog, hover, press_key, type_text, upload_file, click_at
- Navigation (6): close_page, list_pages, navigate_page, new_page, select_page, wait_for
- Emulation (2): emulate, resize_page
- Performance (3): performance_analyze_insight, performance_start_trace, performance_stop_trace
- Network (2): get_network_request, list_network_requests
- Debugging (8): evaluate_script, get_console_message, lighthouse_audit, list_console_messages, take_screenshot, take_snapshot, screencast_start, screencast_stop
- Memory (5): take_heapsnapshot, get_heapsnapshot_class_nodes, get_heapsnapshot_details, get_heapsnapshot_retainers, get_heapsnapshot_summary
- Extensions (5): install_extension, list_extensions, reload_extension, trigger_extension_action, uninstall_extension
- Third-party/WebMCP (4): execute_3p_developer_tool, list_3p_developer_tools, execute_webmcp_tool, list_webmcp_tools
Registering both servers costs roughly 32k tokens of context, around 16 per cent of a 200k-token window. Most agents select the appropriate server automatically when the task description is clear3.
Registering both servers in Codex CLI
Quick setup via CLI
# Playwright MCP — headless, isolated sessions
codex mcp add playwright -- npx @playwright/mcp@latest --headless --isolated

# Chrome DevTools MCP — headless, isolated
codex mcp add chrome-devtools -- npx chrome-devtools-mcp@latest --headless --isolated
Equivalent config.toml
For repeatable project-level configuration, add both to .codex/config.toml:
[mcp_servers.playwright]
command = "npx"
args = ["@playwright/mcp@latest", "--headless", "--isolated"]
startup_timeout_sec = 15

[mcp_servers.chrome-devtools]
command = "npx"
args = ["chrome-devtools-mcp@latest", "--headless", "--isolated"]
startup_timeout_sec = 20
The --isolated flag creates ephemeral browser profiles that are automatically cleaned up, essential for reproducible CI runs6. The --headless flag is mandatory inside Codex CLI’s sandbox, which cannot render a visible browser window7.
Windows note: Chrome DevTools MCP requires SystemRoot and PROGRAMFILES environment variables. Pass them via env = { SystemRoot = "C:\\Windows", PROGRAMFILES = "C:\\Program Files" } in the TOML block4.
Chrome requirement: Chrome DevTools MCP requires Google Chrome stable. It will not work with Chromium, Chrome for Testing, or Edge4. Pre-install Chrome if your CI environment uses a minimal base image.
The browser-in-the-loop workflow
The core pattern chains three phases: generate, drive, inspect. Codex writes code, Playwright exercises it in a headless browser, and Chrome DevTools diagnoses any issues the automation surfaces.
flowchart LR
    A[Codex generates code] --> B[Playwright MCP drives browser]
    B --> C{Tests pass?}
    C -- Yes --> D[Chrome DevTools MCP runs Lighthouse audit]
    C -- No --> E[Chrome DevTools MCP inspects console & network]
    E --> F[Codex fixes code]
    F --> B
    D --> G{Performance OK?}
    G -- Yes --> H[Commit]
    G -- No --> F
Phase 1: generate and drive
Codex writes a React component (or any front-end artefact), spins up a dev server, and uses Playwright MCP to navigate to the page. Playwright reads the browser’s accessibility tree rather than taking screenshots, giving the agent a structured, token-efficient view of the rendered page6. A typical prompt:
Write a login form component. Start the dev server, navigate to /login with
Playwright, and verify the form renders with email and password fields.
Playwright MCP exposes tools like browser_navigate, browser_click, browser_fill, and browser_snapshot that the agent chains together to simulate user flows6. The browser_run_code_unsafe tool allows executing arbitrary Playwright scripts when the standard tools are insufficient.
Phase 2: inspect failures
When an assertion fails, say the password field is missing, the agent switches to Chrome DevTools MCP to drill into the cause:
- Read console errors via
list_console_messagesandget_console_messageto catch runtime exceptions with source-mapped stack traces4 - Inspect network requests via
list_network_requeststo diagnose failed API calls or CORS issues2 - Take a screenshot via
take_screenshotfor visual confirmation (useful when piped to a vision model or saved as a test artefact)4 - Evaluate JavaScript via
evaluate_scriptto inspect component state directly in the page context4 - Record a screencast via
screencast_startandscreencast_stopto capture interaction sequences for debugging complex timing issues4
The agent feeds this diagnostic information back into its reasoning loop and generates a fix, then Playwright re-runs the flow.
Phase 3: performance audit
Once functional tests pass, Chrome DevTools MCP runs a Lighthouse audit:
Run a Lighthouse performance audit on http://localhost:3000/login.
Flag any metrics where LCP > 2.5s, INP > 200ms, or CLS > 0.1.
The lighthouse_audit tool returns structured scores for accessibility, SEO, and best practices (0 to 100)2. The performance_start_trace and performance_stop_trace tools provide V8-level profiling with LCP, CLS, and FCP breakdowns, render-blocking insights with estimated savings, and network dependency trees4.
Phase 4: memory profiling (new)
For single-page applications and long-running dashboards, memory leaks are a common production issue. Chrome DevTools MCP’s heap snapshot tools enable the agent to detect them:
Take a heap snapshot, navigate through 10 dashboard tabs, take another
snapshot, and identify any objects that grew unexpectedly.
The five memory tools (take_heapsnapshot, get_heapsnapshot_summary, get_heapsnapshot_class_nodes, get_heapsnapshot_details, get_heapsnapshot_retainers) give the agent the same inspection capability as the Chrome DevTools Memory panel4.
Practical example: testing a dashboard widget
Here is a concrete session showing the loop in action. The developer’s prompt:
Add a bar chart widget to the analytics dashboard that loads data from
/api/metrics. Write a Playwright test that verifies the chart renders with
the correct number of bars. Then run a Lighthouse audit and fix any
performance issues.
The agent:
- Generates
src/components/BarChart.tsxandtests/bar-chart.spec.ts - Drives the browser with Playwright MCP:
browser_navigatetohttp://localhost:3000/dashboardbrowser_snapshotreads the accessibility tree, confirms five<rect>elementsbrowser_clickinteracts with tooltip hover states
- Audits with Chrome DevTools MCP:
lighthouse_auditreturns LCP at 3.1s (above threshold)list_network_requestsidentifies a 1.2 MB unminified chart library
- Fixes by switching to a tree-shakeable import and adding
React.lazy() - Re-audits: LCP at 1.8s, passes
The entire loop runs without the developer touching the browser.
Token efficiency: MCP vs CLI
Microsoft ships @playwright/cli alongside the MCP server. The CLI approach uses approximately 27k tokens per automation task versus 114k tokens for the equivalent MCP workflow, roughly a four-times reduction8. The trade-off: CLI mode is stateless and better suited to deterministic, reproducible CI pipelines, whereas MCP retains persistent browser state across tool calls, enabling the adaptive reasoning loops that make browser-in-the-loop debugging effective5.
Rule of thumb: use Playwright CLI for high-throughput test execution in CI; use Playwright MCP when the agent needs to reason iteratively about browser state, which is the primary use case in this workflow.
Codex CLI sandbox constraints
Codex CLI’s sandbox disables outbound network access by default7. This has implications for browser-in-the-loop testing:
- Local dev servers work fine.
localhosttraffic stays within the sandbox. - External URLs are blocked. Testing against production requires explicit network access, not just
--full-auto. Setsandbox_workspace_write.network_access = truein your config or usecodex -c 'sandbox_workspace_write.network_access=true'7. - Browser downloads may fail. Pre-install browser binaries via
npx playwright install chromiumin your setup script before entering the sandbox. - Headed mode is unavailable. Always pass
--headlessto both MCP servers.
Note: --full-auto (shortcut for --ask-for-approval on-request and --sandbox workspace-write) does not enable network access. You must set network_access = true separately7.
For teams needing external access during testing, configure network access in your sandbox policy or run the browser MCP servers outside the sandbox with a remote HTTP transport.
Combining with AGENTS.md
Codex reads AGENTS.md at the project root for session-level instructions9. Adding browser-testing conventions here ensures consistent behaviour:
## Browser testing

- Use Playwright MCP for all E2E interaction (navigation, clicks, assertions)
- Use Chrome DevTools MCP for debugging failures, performance audits, and memory profiling
- Always run in headless + isolated mode
- Use role-based locators (getByRole, getByLabel) over CSS selectors
- Run Lighthouse after every new page or component — flag LCP > 2.5s
- Save screenshots of failures to test-results/screenshots/
- For memory-sensitive SPAs, take heap snapshots before and after navigation sequences
This keeps the agent aligned across sessions without repeating instructions in every prompt.
When to use which tool
flowchart TD
    A[Browser task needed] --> B{What kind?}
    B -- "Drive user flows" --> C[Playwright MCP]
    B -- "Debug failures" --> D[Chrome DevTools MCP]
    B -- "Performance audit" --> D
    B -- "Cross-browser check" --> C
    B -- "Network mocking" --> C
    B -- "Heap/memory profiling" --> D
    B -- "Record interaction" --> D
    C --> E{Need inspection?}
    E -- Yes --> D
    E -- No --> F[Done]
    D --> G{Need re-drive?}
    G -- Yes --> C
    G -- No --> F
The two servers form a feedback loop: Playwright surfaces problems by exercising the application; Chrome DevTools explains why those problems exist. Together with Codex CLI’s code generation, they close the gap between writing code and verifying it works.
Citations
-
Microsoft, ‘Playwright MCP Server,’ GitHub, 2026. https://github.com/microsoft/playwright-mcp ↩
-
Google, ‘Chrome DevTools MCP,’ Chrome for Developers Blog, 2026. https://developer.chrome.com/blog/chrome-devtools-mcp ↩ ↩2 ↩3
-
S. Kinney, ‘Driving vs Debugging the Browser,’ 2026. https://stevekinney.com/writing/driving-vs-debugging-the-browser ↩ ↩2
-
Google, ‘Chrome DevTools MCP,’ GitHub, 2026. https://github.com/ChromeDevTools/chrome-devtools-mcp ↩ ↩2 ↩3 ↩4 ↩5 ↩6 ↩7 ↩8 ↩9 ↩10 ↩11
-
Test-Lab.ai, ‘Chrome DevTools MCP vs Playwright MCP vs Playwright CLI,’ 2026. https://www.test-lab.ai/blog/chrome-devtools-mcp-vs-playwright-mcp-cli ↩ ↩2
-
Microsoft, ‘Playwright MCP, Official Documentation,’ 2026. https://playwright.dev/docs/getting-started-mcp ↩ ↩2 ↩3
-
OpenAI, ‘Model Context Protocol, Codex,’ OpenAI Developers, 2026. https://developers.openai.com/codex/mcp ↩ ↩2 ↩3 ↩4
-
MorphLLM, ‘Playwright MCP Setup and Cost: Why the CLI Is 4x Cheaper,’ 2026. https://www.morphllm.com/playwright-mcp ↩
-
TestDino, ‘Write Playwright Tests with Codex: Cloud Agent Guide,’ 2026. https://testdino.com/blog/playwright-tests-with-codex/ ↩