Codex CLI Observability Dashboards: Production Monitoring with SigNoz, Oodle, and Opik
Codex CLI Observability Dashboards: Production Monitoring with SigNoz, Oodle, and Opik
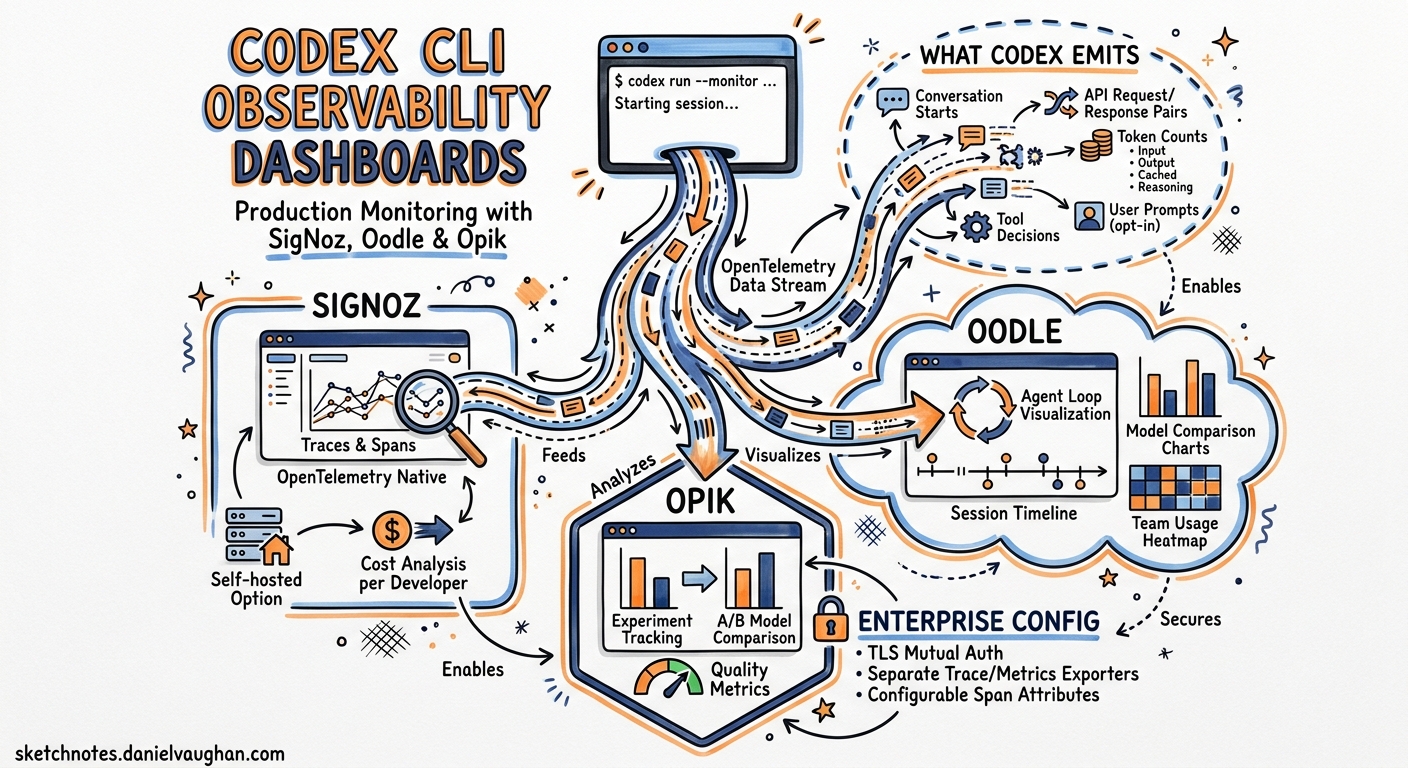
Running Codex CLI in a team of one requires no observability. Running it across a dozen developers, each spawning interactive sessions, CI pipelines, and background codex exec jobs, demands answers to questions that terminal output cannot provide: who is consuming tokens, which models are cost-effective, where are agent loops stalling, and how does approval friction map to session duration? Since v0.117, Codex has shipped opt-in OpenTelemetry export1. With v0.130 (8 May 2026), that surface expanded to include separate trace and metrics exporters, configurable span attributes, and TLS mutual authentication for enterprise endpoints2. Three third-party platforms — SigNoz, Oodle, and Opik — now offer pre-built Codex integrations that turn raw OTLP events into actionable dashboards. This article walks through all three, compares what each provides, and shows how to wire the configuration for a production deployment.
What Codex Emits
Before choosing a backend, it helps to understand the telemetry surface. Codex emits structured OpenTelemetry log events covering the full session lifecycle1:
- Conversation starts with model, sandbox mode, and approval policy metadata
- API request/response pairs including token counts (input, output, cached, reasoning)
- Tool decisions (shell commands, file writes, MCP calls) with timing data
- Tool results including exit codes and truncated output
- User prompts (opt-in via
log_user_prompt)
As of v0.130, the interactive TUI, codex exec, and codex remote-control all emit telemetry. The codex mcp-server entrypoint still has gaps tracked in Issue #129133.
flowchart LR
    subgraph Codex["Codex CLI Sessions"]
        TUI["Interactive TUI"]
        EXEC["codex exec"]
        RC["codex remote-control"]
    end
    subgraph Export["OTLP Export"]
        LOG["Log Exporter"]
        TRACE["Trace Exporter"]
        METRIC["Metrics Exporter"]
    end
    subgraph Backends["Observability Backends"]
        SN["SigNoz"]
        OO["Oodle"]
        OP["Opik"]
        GR["Grafana / Jaeger"]
    end
    TUI --> LOG
    TUI --> TRACE
    TUI --> METRIC
    EXEC --> LOG
    EXEC --> TRACE
    RC --> LOG
    RC --> TRACE
    LOG --> SN
    LOG --> OO
    TRACE --> OP
    LOG --> GR
    TRACE --> SN
    METRIC --> OO
The v0.130 Configuration Reference
Codex’s [otel] section in config.toml supports three independent exporter channels — logs, traces, and metrics — each configurable with separate endpoints, headers, and TLS settings4.
Minimal Setup: Logs Only
[otel]
environment = "production"
log_user_prompt = false

exporter = { otlp-http = {
  endpoint = "https://otel-collector.internal:4318/v1/logs",
  protocol = "binary",
  headers = { "Authorization" = "Bearer ${OTEL_TOKEN}" }
}}
Full Setup: Logs, Traces, and Metrics to Separate Endpoints
[otel]
environment = "production"
log_user_prompt = false

# Log events (conversation starts, tool decisions, prompts)
exporter = { otlp-http = {
  endpoint = "https://logs.observability.internal/v1/logs",
  protocol = "binary",
  headers = { "x-api-key" = "${OTEL_API_KEY}" }
}}

# Distributed traces (span-level timing)
trace_exporter = { otlp-http = {
  endpoint = "https://traces.observability.internal/v1/traces",
  protocol = "binary",
  headers = { "x-api-key" = "${OTEL_API_KEY}" }
}}

# Metrics (token counters, latency histograms)
metrics_exporter = { otlp-http = {
  endpoint = "https://metrics.observability.internal/v2/otlp/metrics",
  protocol = "binary",
  headers = { "x-api-key" = "${OTEL_API_KEY}" }
}}
Enterprise TLS Configuration
For environments behind TLS-inspecting proxies or requiring mutual TLS:
[otel]
exporter = { otlp-grpc = {
  endpoint = "https://otel.corp.internal:4317",
  headers = { "x-team" = "platform-engineering" },
  tls.ca-certificate = "/etc/ssl/corp-ca.pem",
  tls.client-certificate = "/etc/ssl/codex-client.pem",
  tls.client-private-key = "/etc/ssl/codex-client-key.pem"
}}
This resolves a long-standing friction point where developers behind corporate proxies could not export telemetry without custom certificate handling4.
SigNoz: Open-Source Dashboards with a Pre-Built Codex Template
SigNoz is an open-source observability platform built natively on OpenTelemetry5. It offers a dedicated Codex monitoring integration and a pre-built dashboard template — making it the lowest-friction option for teams that want production dashboards without vendor lock-in.
Configuration
[otel]
environment = "production"
log_user_prompt = true

exporter = { otlp-grpc = {
  endpoint = "https://ingest.eu.signoz.cloud:443",
  headers = { "signoz-ingestion-key" = "${SIGNOZ_KEY}" }
}}
For self-hosted SigNoz, point the endpoint at your collector (http://signoz-otel-collector:4317) and remove the ingestion key header5.
The Codex Dashboard Template
SigNoz ships a pre-built dashboard with 13 panels covering four monitoring dimensions6:
| Dimension | Panels | What It Shows |
|---|---|---|
| Usage & Cost | Total tokens, cached tokens, cache utilisation | Token burn rate and cache efficiency |
| Performance | P95 command duration, request success rate | Where sessions stall or fail |
| Adoption | Conversation frequency, user distribution, environment breakdown | Which developers use Codex and from where |
| Model & Tool | Model distribution, tokens per model, tool type usage | Cost allocation by model and workflow type |
The User Decisions panel — a pie chart of acceptance versus rejection rates for agent-proposed commands — gives engineering managers a proxy for trust calibration across the team6.
When to Choose SigNoz
SigNoz is strongest when your organisation already runs an OpenTelemetry collector, wants self-hosted options, or needs logs, traces, and metrics in a single pane. The open-source tier provides full functionality; SigNoz Cloud adds managed infrastructure and the pre-built Codex dashboard template5.
Oodle: Session-Level Agent Observability
Oodle positions itself as an AI agent observability platform — distinct from general-purpose OTLP backends, it structures data around agent sessions rather than generic service spans7. For Codex, this means turn-by-turn session reconstruction.
Configuration
[otel]
environment = "production"
log_user_prompt = true

exporter = { otlp-http = {
  endpoint = "https://logs.oodle.example/ingest/otel/v1/logs",
  protocol = "binary",
  headers = {
    "X-API-KEY" = "${OODLE_API_KEY}",
    "X-OODLE-INSTANCE" = "${OODLE_INSTANCE_ID}"
  }
}}

metrics_exporter = { otlp-http = {
  endpoint = "https://metrics.oodle.example/v2/otlp/metrics/${OODLE_INSTANCE_ID}",
  protocol = "binary",
  headers = {
    "X-API-KEY" = "${OODLE_API_KEY}",
    "X-OODLE-INSTANCE" = "${OODLE_INSTANCE_ID}"
  }
}}
Oodle also supports one-click setup through its Settings → Integrations → AI Agent Observability tile7.
The Session Timeline
Oodle’s differentiator is the Sessions interface. Each session displays:
- User email, model, prompt count, duration, tool calls, token totals, and error count in a summary row
- Expandable turn-by-turn event timeline with raw JSON payloads
- Grouped views by conversation ID for multi-turn reconstruction
The Grafana-embedded charts dashboard adds aggregate views: token consumption trends, WebSocket success/failure rates, tool invocation activity, and latency measurements including end-to-end duration, time-to-first-token, and time-to-first-message7.
Unique Metrics
Oodle captures infrastructure performance signals that other platforms miss: startup prewarm duration, shell snapshot timing, and WebSocket request patterns — useful for diagnosing latency that originates in the harness rather than the model7.
When to Choose Oodle
Oodle is strongest when you need session-level forensics — debugging why a specific developer’s session stalled, auditing what a CI agent touched, or correlating tool call patterns with token spend. Its agent-native data model avoids the impedance mismatch of fitting agent telemetry into generic APM schemas.
Opik: Trace-First LLM Observability
Opik, from Comet, takes a trace-first approach. Where SigNoz and Oodle consume log events, Opik ingests distributed traces — making it the natural choice for teams that want span-level visibility into the agent loop’s internal timing8.
Configuration
[otel]
trace_exporter = "otlp-http"
log_user_prompt = false

[otel.trace_exporter.otlp-http]
endpoint = "https://www.comet.com/opik/api/v1/private/otel/v1/traces"
protocol = "binary"
headers = {
  "Authorization" = "Bearer ${OPIK_API_KEY}",
  "Comet-Workspace" = "my-workspace",
  "projectName" = "codex-production"
}
For self-hosted Opik, adjust the endpoint to your deployment URL and remove the workspace header8.
Trace Analysis
Opik records every step from prompt chains to tool calls, letting you search and filter by custom tags. Each trace shows the full span tree — model inference, tool execution, sandbox overhead, and approval wait times — with wall-clock timing at every level8.
When to Choose Opik
Opik is strongest when you already use Comet for ML experiment tracking, want trace-level (not just session-level) visibility, or need to compare Codex performance across model versions using Opik’s evaluation framework.
Comparison Matrix
| Capability | SigNoz | Oodle | Opik |
|---|---|---|---|
| Primary signal | Logs + traces + metrics | Logs + metrics | Traces |
| Pre-built Codex dashboard | ✅ 13-panel template | ✅ Grafana-embedded | ❌ Manual setup |
| Session reconstruction | Partial (via trace correlation) | ✅ Native turn-by-turn | ✅ Via span trees |
| Self-hosted option | ✅ Open-source | ❌ Cloud only | ✅ Open-source |
| mTLS support | ✅ Via collector | ✅ | ✅ |
| Token cost tracking | ✅ | ✅ | ❌ (traces only) |
| WebSocket/infra metrics | ❌ | ✅ | ❌ |
| ML experiment correlation | ❌ | ❌ | ✅ |
| Codex-specific setup docs | ✅ | ✅ | ✅ |
| Price | Free tier + Cloud paid | Paid | Free tier + Cloud paid |
Dual-Export Pattern
You do not need to pick just one. Codex’s separate exporter, trace_exporter, and metrics_exporter channels let you route different signals to different backends:
[otel]
environment = "production"
log_user_prompt = true

# Session logs → SigNoz for dashboards and alerting
exporter = { otlp-grpc = {
  endpoint = "https://ingest.eu.signoz.cloud:443",
  headers = { "signoz-ingestion-key" = "${SIGNOZ_KEY}" }
}}

# Distributed traces → Opik for span-level debugging
trace_exporter = { otlp-http = {
  endpoint = "https://www.comet.com/opik/api/v1/private/otel/v1/traces",
  protocol = "binary",
  headers = {
    "Authorization" = "Bearer ${OPIK_KEY}",
    "Comet-Workspace" = "engineering"
  }
}}

# Metrics → Oodle for infrastructure performance
metrics_exporter = { otlp-http = {
  endpoint = "https://metrics.oodle.example/v2/otlp/metrics/${OODLE_ID}",
  protocol = "binary",
  headers = { "X-API-KEY" = "${OODLE_KEY}" }
}}
This three-backend configuration routes each signal to the platform best suited to consume it, without duplication at the Codex level4.
Profile-Based Observability
Use named profiles to switch observability configurations by context:
[profile.dev.otel]
environment = "development"
exporter = "none"

[profile.ci.otel]
environment = "ci"
exporter = { otlp-http = {
  endpoint = "https://ingest.signoz.cloud:443/v1/logs",
  headers = { "signoz-ingestion-key" = "${SIGNOZ_KEY}" }
}}
log_user_prompt = true

[profile.production.otel]
environment = "production"
exporter = { otlp-grpc = {
  endpoint = "https://otel-collector.internal:4317"
}}
trace_exporter = { otlp-http = {
  endpoint = "https://opik.internal/v1/traces",
  protocol = "binary"
}}
Then invoke the relevant profile: codex -p ci exec "Run the test suite" or codex -p production4.
Practical Deployment Checklist
-
Start with log export only. The
exporterchannel captures 90% of what you need for cost tracking and adoption metrics. Addtrace_exporterandmetrics_exporterwhen you need span-level debugging or infrastructure performance data. -
Keep
log_user_prompt = falseby default. Enable it only in environments where prompt text is acceptable in your telemetry pipeline. Enterprise compliance teams should review prompt logging against data classification policies. -
Use profiles to disable export in development. Local sessions do not need to hit production OTLP endpoints. Set
exporter = "none"in your default ordevprofile. -
Batch latency is real. Codex batches OTLP events asynchronously and flushes on shutdown. Expect a 10–30 second delay before data appears in your backend5. Do not rely on real-time alerting for individual session events.
-
Monitor the
codex execgap. As of v0.130,codex execemits logs and traces but not all metrics. If your cost accounting depends on metrics counters from CI pipelines, supplement with log-derived token counts until Issue #12913 is fully resolved3. -
Test TLS before rollout. Corporate proxy environments commonly break OTLP export. Use the mTLS configuration with explicit CA certificate paths if you see TLS handshake failures.
What Comes Next
The v0.130 release notes mention configurable span attributes and W3C tracestate fields2, enabling teams to inject custom metadata (team ID, cost centre, sprint) into every exported span. ⚠️ The exact [otel.span_attributes] and [otel.tracestate] configuration syntax is documented in the release notes but not yet reflected in the official configuration reference page4. Early adopters should consult the v0.130.0 GitHub release for the current schema.