Codex CLI Observability with OpenTelemetry: Tracing Agent Sessions, Tool Calls, and API Requests
Codex CLI Observability with OpenTelemetry: Tracing Agent Sessions, Tool Calls, and API Requests
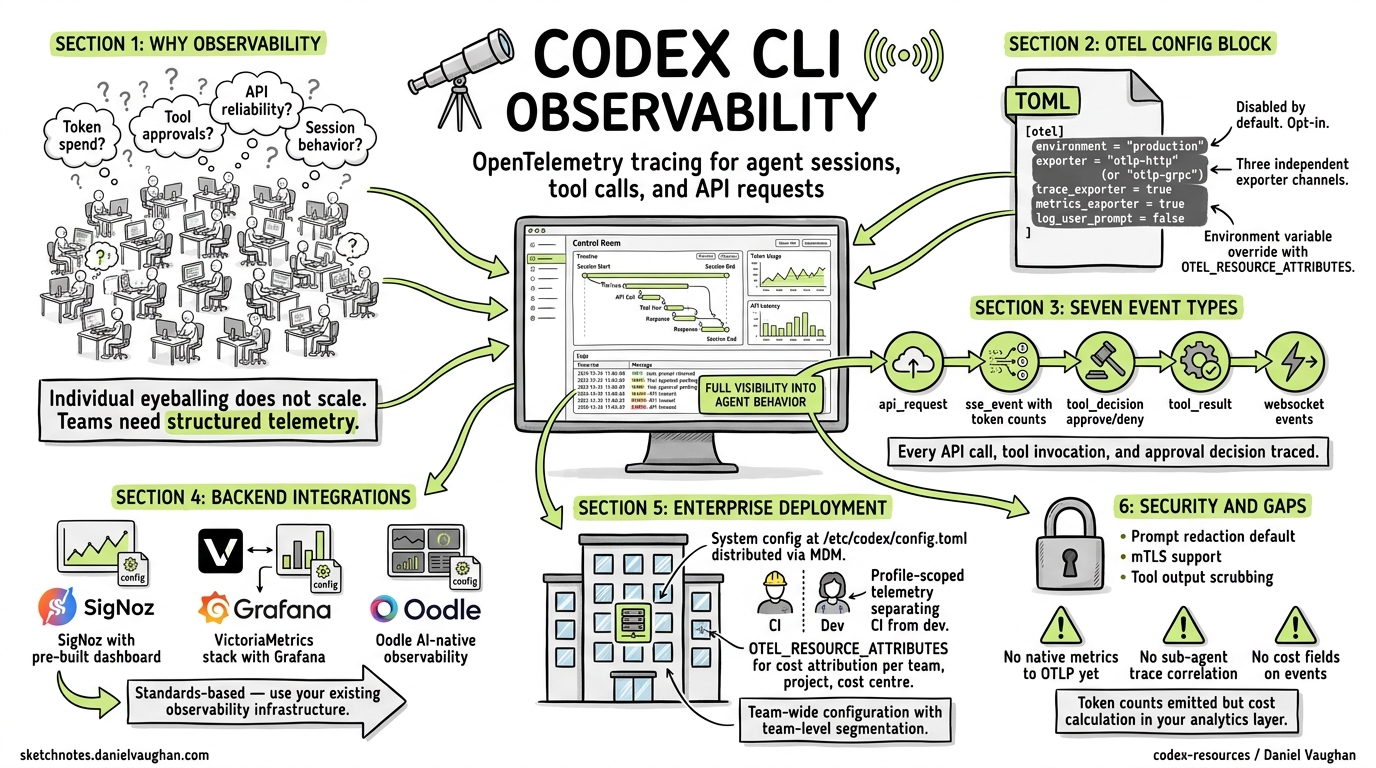
As coding agents move from individual experimentation to team-wide adoption, the question shifts from “does it work?” to “how well is it working, and what is it costing us?” Codex CLI ships with built-in OpenTelemetry (OTel) support 1, giving teams a standards-based pipeline for tracing every API request, tool invocation, and approval decision their agents make. This article covers the full observability stack: configuration, event schema, metrics derivation, backend integration, and enterprise deployment patterns.
Why Agent Observability Matters
A single developer running Codex interactively can eyeball costs and spot problems. A team of forty developers, each running multiple agent sessions daily — some with sub-agents, some in CI/CD pipelines via codex exec — cannot. Without structured telemetry, you are flying blind on:
- Token spend — which models, sessions, and developers consume the most tokens
- Tool approval patterns — how often agents request dangerous operations, and whether your policy configuration is too permissive or too restrictive
- API reliability — retry rates, error distributions, and latency percentiles
- Session behaviour — context compaction frequency, conversation length distributions, and sub-agent delegation patterns
OpenTelemetry provides the standard plumbing to answer these questions using your existing observability infrastructure 2.
The [otel] Configuration Block
All telemetry configuration lives in ~/.codex/config.toml under the [otel] section. By default, telemetry is disabled — no data leaves your machine until you explicitly opt in 1.
Minimal Setup
[otel]
environment = "production"
exporter = { otlp-http = {
  endpoint = "https://otel-collector.internal:4318/v1/logs",
  protocol = "binary"
}}
This sends structured log events over OTLP/HTTP with Protobuf encoding. For gRPC transport:
[otel]
environment = "production"
exporter = { otlp-grpc = {
  endpoint = "https://otel-collector.internal:4317"
}}
Full Configuration Reference
The [otel] block supports three independent exporter channels 3:
| Key | Type | Default | Purpose |
|---|---|---|---|
environment |
string |
"dev" |
Environment tag on all emitted events |
exporter |
none \| otlp-http \| otlp-grpc |
none |
Log event exporter |
trace_exporter |
none \| otlp-http \| otlp-grpc |
none |
Distributed trace exporter |
metrics_exporter |
none \| statsig \| otlp-http \| otlp-grpc |
statsig |
Metrics pipeline exporter |
log_user_prompt |
boolean |
false |
Include raw prompts in telemetry |
Each exporter variant accepts the same sub-keys:
[otel.exporter.otlp-http]
endpoint = "https://collector.example.com/v1/logs"
protocol = "binary"                    # or "json"
headers = { "x-api-key" = "${OTLP_TOKEN}" }

[otel.exporter.otlp-http.tls]
ca-certificate = "/etc/ssl/ca.pem"
client-certificate = "/etc/ssl/client.pem"
client-private-key = "/etc/ssl/client-key.pem"
The trace_exporter block mirrors this structure at otel.trace_exporter.<variant> 3.
Environment Variable Override
For ephemeral environments and CI pipelines, standard OTel environment variables work alongside the TOML configuration:
export OTEL_RESOURCE_ATTRIBUTES="env=ci,team.id=platform,department=engineering"
Resource attributes are merged with TOML-configured values, enabling team-level segmentation without modifying shared configuration files 4.
Event Schema: What Codex Emits
Every OTel event includes a common set of attributes 1 4:
| Attribute | Description |
|---|---|
service.name |
Always codex_cli_rs |
app.version |
CLI version (e.g. 0.121.0) |
env |
From otel.environment |
conversation.id |
Unique session identifier |
model |
Active model (e.g. gpt-5.4) |
terminal.type |
Terminal emulator in use |
auth_mode |
Authentication method |
session_source |
How the session was initiated |
Structured Log Events
Codex emits seven distinct event types 1:
flowchart LR
    A[User Prompt] --> B[codex.user_prompt]
    B --> C[codex.api_request]
    C --> D[codex.sse_event]
    D --> E{Tool Call?}
    E -->|Yes| F[codex.tool_decision]
    F --> G[codex.tool_result]
    G --> C
    E -->|No| H[Response Complete]

    style A fill:#e1f5fe
    style H fill:#e8f5e9
codex.conversation_starts
Emitted once per session. Captures the model, reasoning effort level, sandbox mode, approval policy, and connected MCP servers 1. This is your baseline for understanding session configuration across the team.
codex.api_request
Every outbound API call, including retries. Key fields: attempt count, HTTP status, duration_ms, and error details 1. This is where you detect rate limiting, model availability issues, and latency regressions.
codex.sse_event
Server-sent event stream processing. On response.completed events, includes token counts broken down by category: input_tokens, output_tokens, cached_tokens, and reasoning_tokens 1 4. These four counters are the foundation of cost attribution.
codex.websocket_request and codex.websocket_event
For WebSocket-based transports (WebRTC voice, Realtime API). Captures per-message kind, success/failure, and error details 1.
codex.user_prompt
Captures prompt length. Content is redacted by default — only emitted when log_user_prompt = true 1. Enterprise deployments should generally leave this disabled unless operating under explicit data-handling agreements.
codex.tool_decision
Records every tool approval decision: the tool name, whether it was approved or denied, and critically, whether the decision came from configuration (auto-approved by policy) or from user interaction 1. This event is invaluable for tuning approval policies — if 95% of tool decisions are user-approved shell commands of the same pattern, you probably need a more permissive rule.
codex.tool_result
Tool execution outcome: duration, success/failure, and an output snippet 1. Correlating tool duration with tool type reveals which operations are bottlenecking your agent sessions.
Metrics: Counters and Histograms
When the metrics pipeline is enabled, Codex emits counters and duration histograms for API, stream, and tool activity 1. Default metadata tags include auth_mode, originator, session_source, model, and app.version.
Note that the log exporter and the metrics exporter are independent channels — you can send logs to one backend and metrics to another 3. A common pattern is using the default Statsig metrics exporter for OpenAI’s own analytics while routing logs and traces to your internal observability stack.
Backend Integration Patterns
Pattern 1: SigNoz Cloud
SigNoz provides a pre-built Codex dashboard template 5:
[otel]
log_user_prompt = false
exporter = { otlp-grpc = {
  endpoint = "https://ingest.eu.signoz.cloud:443",
  headers = { "signoz-ingestion-key" = "${SIGNOZ_KEY}" }
}}
trace_exporter = { otlp-grpc = {
  endpoint = "https://ingest.eu.signoz.cloud:443",
  headers = { "signoz-ingestion-key" = "${SIGNOZ_KEY}" }
}}
The SigNoz Sessions tab shows individual sessions with user, model, prompt count, duration, tool calls, token totals, and error counts — expandable to turn-by-turn event timelines 5.
Pattern 2: VictoriaMetrics Stack
For self-hosted deployments, the VictoriaMetrics stack accepts OTLP data across three storage engines 4:
[otel]
environment = "production"

[otel.exporter.otlp-http]
endpoint = "http://otel-collector:4318/v1/logs"
protocol = "binary"

[otel.trace_exporter.otlp-http]
endpoint = "http://otel-collector:4318/v1/traces"
protocol = "binary"
flowchart TB
    subgraph Codex Sessions
        A[Developer A] --> C[OTel Collector]
        B[Developer B] --> C
        D[CI Pipeline] --> C
    end
    subgraph VictoriaMetrics Stack
        C --> E[VictoriaLogs]
        C --> F[VictoriaTraces]
        C --> G[VictoriaMetrics]
    end
    E --> H[Grafana Dashboards]
    F --> H
    G --> H
VictoriaLogs supports LogsQL queries for filtering Codex events — for example, querying all tool denials across the team in the last 24 hours 4. Community dashboards are available in the VictoriaMetrics-Community/vibe-coding-dashboards repository 4.
Pattern 3: Oodle AI-Native Observability
Oodle provides purpose-built AI agent observability, tracking ten metric types including time-to-first-token, end-to-end turn duration, and token usage by category 6:
[otel]
environment = "production"
metrics_exporter = { otlp-http = {
  endpoint = "https://otel.oodle.ai/v1/metrics",
  headers = { "x-api-key" = "${OODLE_KEY}", "x-instance-id" = "${OODLE_INSTANCE}" }
}}
Oodle’s Sessions tab reconstructs full conversation timelines grouped by conversation.id, showing the interleaving of API calls, tool executions, and approval decisions 6.
Enterprise Deployment: Team-Wide Configuration
Managed Configuration Distribution
Use the system-level config at /etc/codex/config.toml to enforce telemetry across all developers in an organisation 3:
# /etc/codex/config.toml — distributed via MDM or Ansible
[otel]
environment = "production"
log_user_prompt = false

[otel.exporter.otlp-grpc]
endpoint = "https://otel-gateway.corp.internal:4317"
headers = { "x-team-token" = "${CODEX_OTEL_TOKEN}" }

[otel.trace_exporter.otlp-grpc]
endpoint = "https://otel-gateway.corp.internal:4317"
headers = { "x-team-token" = "${CODEX_OTEL_TOKEN}" }
Because system config has the lowest precedence 3, developers can layer personal overrides (e.g. environment = "dev") without disabling the enterprise telemetry pipeline.
Profile-Scoped Telemetry
Different profiles can route to different backends:
[profiles.ci]
model = "gpt-5.4-mini"

[profiles.ci.otel]
environment = "ci"
exporter = { otlp-http = {
  endpoint = "https://ci-collector.internal:4318/v1/logs"
}}
This keeps CI pipeline telemetry separate from interactive developer sessions, reducing noise in both directions.
Cost Attribution with Resource Attributes
Combine OTEL_RESOURCE_ATTRIBUTES with your collector’s routing rules to attribute costs per team, project, or cost centre:
# Set in developer shell profile or CI environment
export OTEL_RESOURCE_ATTRIBUTES="team.id=platform,project=api-gateway,cost_centre=CC-4521"
Then use your backend’s query language to aggregate token counts by team.id or cost_centre — the codex.sse_event token fields provide the raw data 4.
Security Considerations
- Prompt redaction:
log_user_promptdefaults tofalsefor good reason — prompts may contain proprietary code, credentials, or sensitive business logic 1. Enable it only in controlled environments with appropriate data-handling agreements. - mTLS: Both exporter variants support full mTLS via
tls.ca-certificate,tls.client-certificate, andtls.client-private-key3. Use these in zero-trust environments rather than relying solely on header-based authentication. - Tool output snippets:
codex.tool_resultincludes output snippets that could contain secrets. Ensure your OTel collector pipeline includes scrubbing processors before forwarding to shared backends. - Async flush: Exporters operate asynchronously and flush on shutdown 1, so short-lived
codex execsessions in CI should allow a brief grace period for final event delivery.
What’s Missing (and What’s Coming)
The current OTel implementation has notable gaps:
- No native metrics export to OTLP ⚠️ — Codex exports logs and traces natively, but metrics currently default to Statsig. You can configure
metrics_exporterfor OTLP, but the metric catalogue is less mature than the event catalogue 3 4. - No sub-agent correlation ⚠️ — multi-agent v2 sessions spawn child agents, but trace context propagation between parent and child agent sessions is not yet implemented. You can correlate manually via
conversation.idpatterns. - No cost fields on events ⚠️ — token counts are emitted but not multiplied by per-model pricing. Cost calculation must happen in your analytics layer.
The guardian review system (v0.121.0) already emits review_id identifiers and timeout events 7, suggesting that governance telemetry will deepen in future releases. The analytics schema PR (#17055) points toward a more structured metrics catalogue.
Citations
-
OpenAI, “Advanced Configuration — Codex,” https://developers.openai.com/codex/config-advanced ↩ ↩2 ↩3 ↩4 ↩5 ↩6 ↩7 ↩8 ↩9 ↩10 ↩11 ↩12 ↩13 ↩14
-
OpenTelemetry, “What is OpenTelemetry?” https://opentelemetry.io/docs/what-is-opentelemetry/ ↩
-
OpenAI, “Configuration Reference — Codex,” https://developers.openai.com/codex/config-reference ↩ ↩2 ↩3 ↩4 ↩5 ↩6 ↩7
-
VictoriaMetrics, “Vibe coding tools observability with VictoriaMetrics Stack and OpenTelemetry,” https://victoriametrics.com/blog/vibe-coding-observability/ ↩ ↩2 ↩3 ↩4 ↩5 ↩6 ↩7 ↩8
-
SigNoz, “OpenAI Codex Observability & Monitoring with OpenTelemetry,” https://signoz.io/docs/codex-monitoring/ ↩ ↩2
-
Oodle, “OpenAI Codex — AI Agent Observability,” https://docs.oodle.ai/ai-agent-observability/codex ↩ ↩2
-
OpenAI, “Codex CLI Changelog,” https://developers.openai.com/codex/changelog ↩