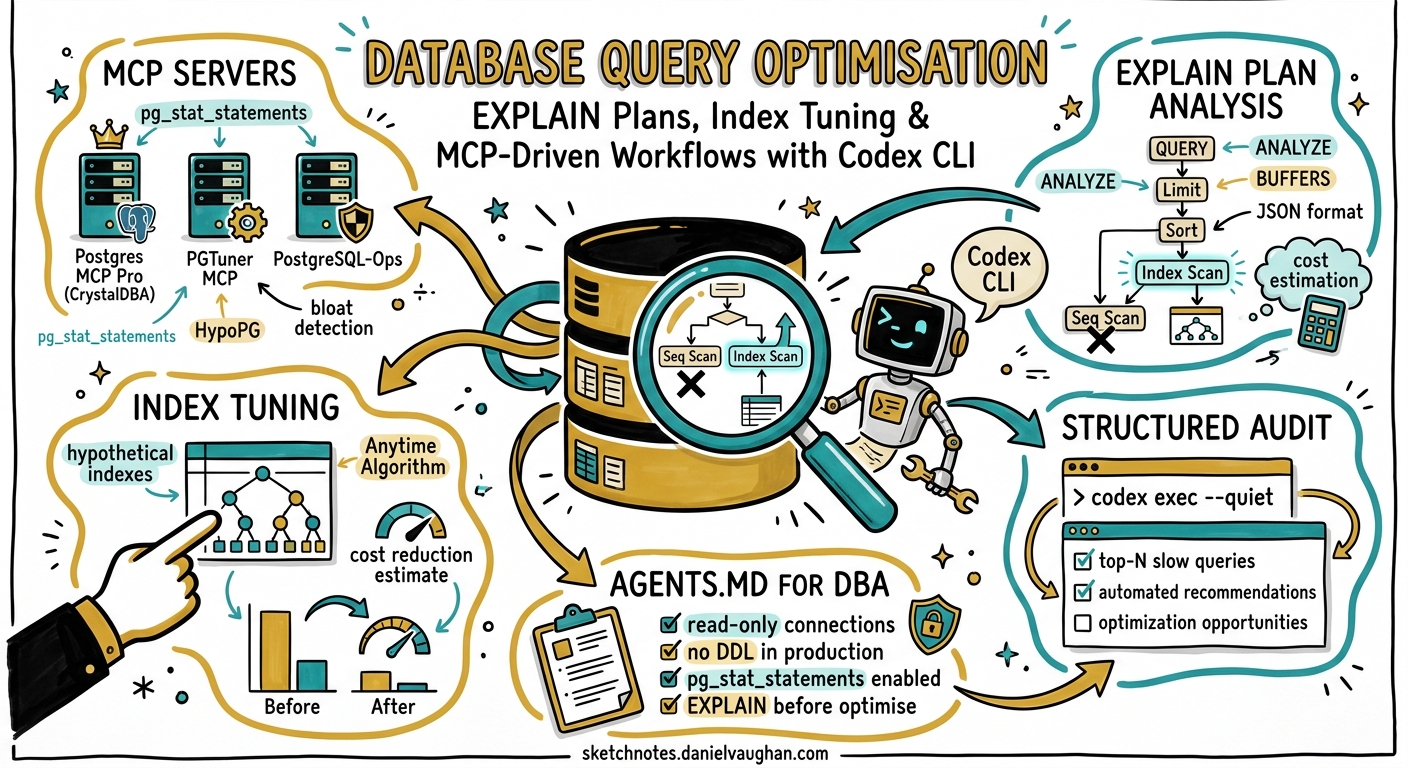
Codex CLI for Database Query Performance Optimisation: EXPLAIN Plan Analysis, Index Tuning, and MCP-Driven Workflows
Codex CLI for Database Query Performance Optimisation: EXPLAIN Plan Analysis, Index Tuning, and MCP-Driven Workflows
Codex CLI has mature coverage for database schema migrations — Atlas, Prisma, Flyway, and Neon branching all have dedicated articles in this knowledge base. What is conspicuously absent is the other half of the database lifecycle: query performance optimisation. This article fills that gap, covering how to use Codex CLI with PostgreSQL MCP servers, AGENTS.md conventions, structured audits via codex exec, and EXPLAIN-plan-driven index tuning workflows.
Why This Matters Now
Database query performance remains the single largest source of production incidents for most backend teams 1. The 2026 ecosystem has converged on three PostgreSQL MCP servers that expose pg_stat_statements, EXPLAIN plans, and hypothetical indexing directly to AI coding agents, making Codex CLI a viable co-pilot for query tuning workflows that previously required deep DBA expertise 2.
The MCP Server Landscape for Query Performance
Three open-source MCP servers provide the tool surface Codex needs to analyse query performance without direct production access.
Postgres MCP Pro (CrystalDBA)
The crystaldba/postgres-mcp server exposes read-only query analysis alongside an implementation of the Anytime Algorithm from Microsoft’s Database Tuning Advisor 3. Key tools include:
get_slow_queries— retrieves the top-N slowest queries frompg_stat_statements, ranked by total execution timeexplain_query— runsEXPLAIN (ANALYZE, BUFFERS, FORMAT JSON)and returns a structured execution plansuggest_indexes— applies the Anytime Algorithm to recommend indexes, including estimated cost reduction
PGTuner MCP
The isdaniel/pgtuner_mcp server adds HypoPG integration for hypothetical index testing without writing to the catalogue 4:
retrieve_slow_queries— pulls slow queries with detailed statisticsanalyze_execution_plan— runs EXPLAIN ANALYZE with annotationtest_hypothetical_index— creates a HypoPG virtual index and re-runs the query to compare plans
MCP-PostgreSQL-Ops
The call518/MCP-PostgreSQL-Ops server provides broader DBA tooling across PostgreSQL 12–18 5, including bloat detection, lock monitoring, and autovacuum analysis — useful context when query slowness stems from table bloat or lock contention rather than missing indexes.
Configuring MCP Servers in Codex CLI
Add the relevant MCP server to your project’s .codex/config.toml:
[mcp_servers.postgres-perf]
command = "npx"
args = ["-y", "@crystaldba/postgres-mcp"]

[mcp_servers.postgres-perf.env]
DATABASE_URL = "$DATABASE_URL"
For PGTuner, the configuration follows the same pattern:
[mcp_servers.pgtuner]
command = "npx"
args = ["-y", "pgtuner-mcp"]

[mcp_servers.pgtuner.env]
PG_CONNECTION_STRING = "$DATABASE_URL"
Sandbox note: These MCP servers need network access to reach the database. Configure
network_accessin your permission profile to allow connections to your database host, or use thenetwork-enabledprofile 6.
AGENTS.md Conventions for Query Performance
Encode your team’s database performance standards in AGENTS.md so Codex respects them across all sessions:
## Database Performance Conventions

- Never run EXPLAIN ANALYZE against production; use a Neon branch or read replica
- All queries returning > 100 rows must use pagination (LIMIT/OFFSET or cursor-based)
- Prefer CTEs over nested subqueries for readability and plan stability
- New indexes require a migration file, not ad-hoc DDL
- Sequential scans on tables > 10,000 rows must be justified in a code comment
- Use covering indexes (INCLUDE) when the query only reads indexed columns
- Foreign keys must have a corresponding index on the referencing column
These conventions prevent Codex from generating queries that pass functional tests but introduce performance regressions.
Interactive Workflow: Analysing Slow Queries
The most common workflow starts with identifying slow queries, then iterating on solutions.
Step 1: Identify Slow Queries
> @postgres-perf get the top 10 slowest queries by total execution time
Codex calls the MCP server’s get_slow_queries tool and returns a ranked list with mean execution time, call count, and total time.
Step 2: Analyse the Execution Plan
> Run EXPLAIN ANALYZE on the slowest query and identify the most expensive nodes
Codex retrieves the JSON execution plan and annotates it, highlighting sequential scans on large tables, nested loop joins with high row estimates, and sort operations spilling to disc.
Step 3: Generate Index Recommendations
> Suggest indexes that would improve this query. Test them with HypoPG before creating migration files.
With PGTuner, Codex creates hypothetical indexes, re-runs EXPLAIN, and compares the estimated cost. Only indexes that demonstrate measurable improvement get promoted to migration files.
flowchart TD
    A[Identify slow queries via pg_stat_statements] --> B[Run EXPLAIN ANALYZE on worst offenders]
    B --> C{Sequential scan on large table?}
    C -- Yes --> D[Generate index candidates]
    C -- No --> E{Nested loop with high row count?}
    E -- Yes --> F[Consider JOIN rewrite or materialised view]
    E -- No --> G[Check for lock contention or bloat]
    D --> H[Test with HypoPG]
    H --> I{Cost reduction > 50%?}
    I -- Yes --> J[Generate migration file]
    I -- No --> K[Consider query rewrite instead]
    F --> J
    J --> L[Validate on Neon branch]
    L --> M[Merge migration PR]
Structured Audit with codex exec
For CI integration, use codex exec with --output-schema to produce machine-readable performance audit reports:
codex exec \
  --model gpt-5.4 \
  --output-schema '{"type":"object","properties":{"slow_queries":{"type":"array","items":{"type":"object","properties":{"query":{"type":"string"},"mean_time_ms":{"type":"number"},"recommendation":{"type":"string"},"severity":{"type":"string","enum":["critical","warning","info"]}}}},"index_recommendations":{"type":"array","items":{"type":"object","properties":{"table":{"type":"string"},"columns":{"type":"array","items":{"type":"string"}},"type":{"type":"string"},"estimated_improvement_pct":{"type":"number"}}}}}}' \
  "Analyse the top 20 slowest queries from pg_stat_statements. For each, run EXPLAIN ANALYZE, classify severity, and recommend indexes or query rewrites."
This produces structured JSON that downstream tooling can ingest — for example, a GitHub Actions step that fails the build if any critical severity queries are found without an accompanying fix.
Safe Testing with Neon Branching
Production databases should never be the target for EXPLAIN ANALYZE or hypothetical index testing in automated pipelines. Neon’s instant branching provides copy-on-write isolation 7:
[mcp_servers.neon]
command = "npx"
args = ["-y", "neon-mcp-server"]

[mcp_servers.neon.env]
NEON_API_KEY = "$NEON_API_KEY"
The workflow becomes:
- Branch — Codex creates a Neon branch from the production snapshot
- Analyse — EXPLAIN ANALYZE runs against the branch with realistic data
- Test — HypoPG indexes are tested on the branch
- Migrate — Validated indexes are written as migration files
- Clean up — The branch is deleted after the analysis completes
This pattern gives Codex access to production-scale data distributions without any risk to live traffic.
Reusable query-tuner Skill
Encapsulate the workflow in a reusable skill at .codex/skills/query-tuner/SKILL.md:
# Query Tuner

## Trigger
Run when asked to analyse slow queries or optimise database performance.

## Steps
1. Connect to the database via the postgres-perf MCP server
2. Retrieve the top 20 slowest queries from pg_stat_statements
3. For each query with mean execution time > 100ms:
   a. Run EXPLAIN ANALYZE and identify bottlenecks
   b. Generate index candidates
   c. Test candidates with HypoPG
   d. If improvement > 30%, generate a migration file
4. Output a summary table: query hash, current mean time, projected mean time, recommended action
5. Create a PR with migration files if any indexes are recommended

## Constraints
- Never modify production data
- All indexes must be created via migration files, never ad-hoc
- Prefer partial indexes for queries with WHERE clauses on a small subset of rows
- Always check for existing indexes that cover the same columns before recommending new ones
PostToolUse Hook for Query Linting
Add a PostToolUse hook that catches common query anti-patterns before they reach production:
[[hooks]]
event = "PostToolUse"
match_tool = "^(Bash|Write)$"
command = "/usr/bin/python3 .codex/hooks/query_lint.py"
The hook script inspects any SQL in tool output for:
SELECT *on tables with more than 10 columns- Missing
WHEREclauses onUPDATEorDELETEstatements LIKE '%pattern%'queries that cannot use B-tree indexes- Cartesian joins (missing join conditions)
When detected, the hook returns feedback steering Codex toward the corrected pattern.
Model Selection for Query Performance Work
| Task | Recommended Model | Rationale |
|---|---|---|
| Slow query triage | GPT-5.3-Codex | Fast enough for iterative analysis, lower cost 8 |
| EXPLAIN plan interpretation | GPT-5.4 | Complex plan trees benefit from stronger reasoning 8 |
| Index recommendation | GPT-5.4 | Needs to reason about selectivity and covering index tradeoffs 8 |
| Migration file generation | GPT-5.3-Codex-Spark | Mechanical code generation, speed matters 8 |
Structured audit (codex exec) |
GPT-5.4 | Output-schema compliance requires higher capability 8 |
Anti-Patterns
- Running EXPLAIN ANALYZE on production — Always use a branch or read replica. Codex has no built-in guardrail against this; your AGENTS.md conventions and sandbox config must enforce it.
- Trusting row estimates blindly — EXPLAIN estimates can be wildly wrong when statistics are stale. Run
ANALYZEon the target table before interpreting plans. ⚠️ - Creating indexes for every slow query — Each index slows writes. Consider query rewrites, materialised views, or application-level caching before adding indexes.
- Ignoring partial indexes — For queries that filter on a boolean flag or status column, a partial index (
WHERE active = true) is often 90% smaller and faster than a full index. - Skipping HypoPG validation — Generating migration files without testing the index against the actual query plan risks creating indexes that the planner does not use.
Known Limitations
--output-schemaand--resumeare mutually exclusive — structured audit output cannot be resumed if interrupted 9- Context window constraints — Large EXPLAIN ANALYZE output (particularly for queries joining 10+ tables) can consume significant context. Use subagent delegation for complex analyses.
- MCP server maturity — The PostgreSQL MCP servers are community-maintained. Test new versions in a non-production environment before upgrading. ⚠️
- HypoPG availability — HypoPG must be installed as a PostgreSQL extension. It is not available on all managed database providers.
- Non-deterministic recommendations — Codex may suggest different indexes across runs for the same query. Use the structured audit output to compare and stabilise recommendations.