Cross-Agent Usage Analytics: Unified Monitoring for Your Mixed Coding Agent Stack
Cross-Agent Usage Analytics: Unified Monitoring for Your Mixed Coding Agent Stack
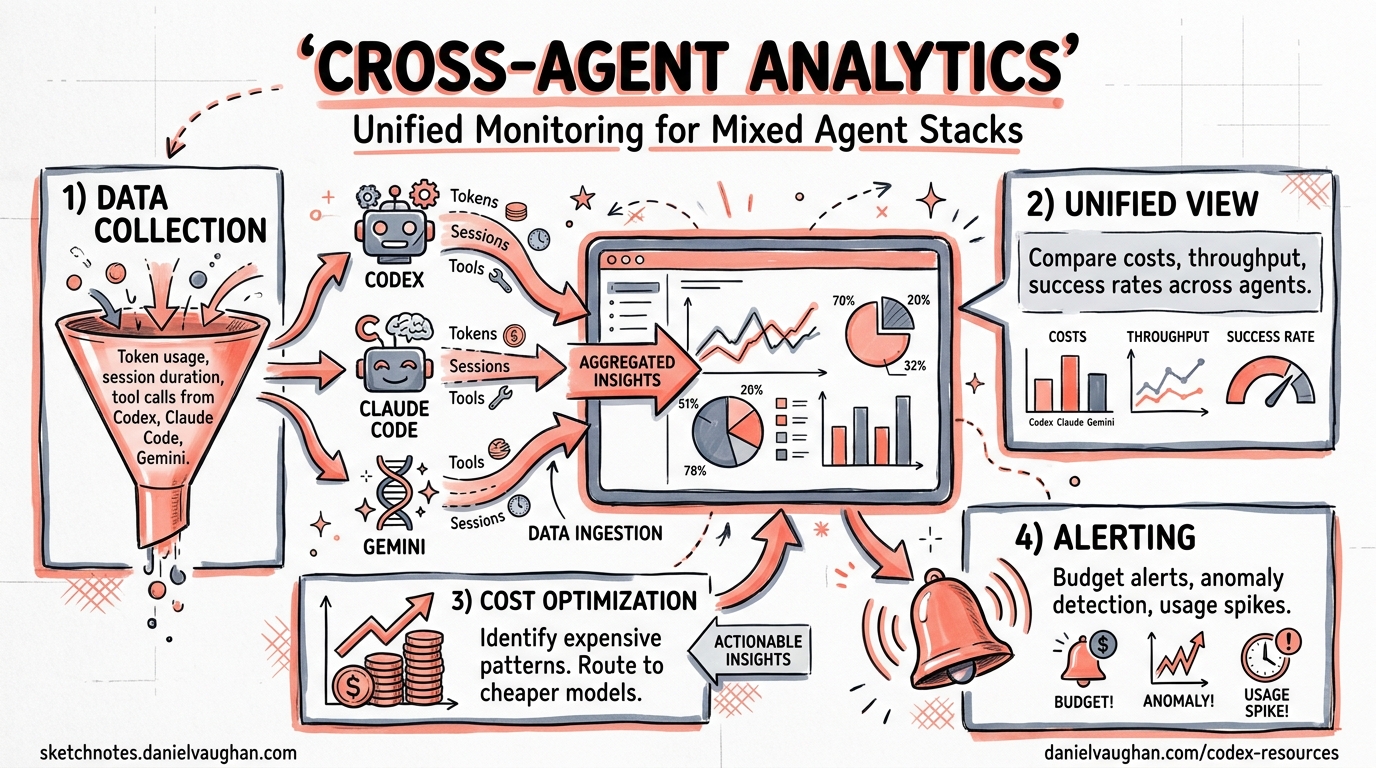
The average senior developer in 2026 runs two to five coding agents daily — Codex CLI for deep implementation, Claude Code for exploration, Cursor for in-editor flow, Copilot for autocomplete, and perhaps Gemini CLI for quick lookups 1. Each tool has its own billing model, rate limits, 5-hour usage windows, and session logs scattered across different directories. Keeping track of spend, quotas, and session history by opening five browser dashboards is untenable.
A new generation of cross-agent usage analytics tools has emerged to solve exactly this problem. This article surveys the five leading options, shows how each integrates with Codex CLI’s session data, and provides a practical decision framework for choosing the right tool for your workflow.
The Problem: Fragmented Visibility
Codex CLI stores session event logs as JSONL files under ~/.codex/sessions/ 2. Claude Code writes to ~/.claude/sessions/. Cursor, Copilot, and Gemini CLI each have their own storage conventions. Without a unified view, you face three concrete risks:
- Budget overruns — Codex CLI’s 5-hour billing windows reset independently from Claude Code’s rate limits 3. A busy afternoon can exhaust both without warning.
- Session archaeology — Finding which agent handled a specific task three days ago requires manually scanning JSONL files across multiple directories.
- Cost attribution — Teams sharing a Codex Business workspace cannot easily attribute token spend to individuals, models, or projects without aggregation tooling.
graph LR
    A["Codex CLI<br/>~/.codex/sessions/"] --> U["Unified Analytics"]
    B["Claude Code<br/>~/.claude/sessions/"] --> U
    C["Cursor<br/>~/.cursor/sessions/"] --> U
    D["Copilot CLI<br/>~/.copilot/sessions/"] --> U
    E["Gemini CLI<br/>~/.gemini/sessions/"] --> U
    U --> R["Dashboard<br/>Spend · Quotas · Sessions"]
The Ecosystem: Five Tools Compared
1. ccusage — The Lightweight Accountant
ccusage is a Node.js CLI that reads local JSONL session files and produces daily, monthly, and session-level cost reports 4. The @ccusage/codex package specifically parses Codex CLI’s token_count events, computing per-turn deltas from cumulative totals and mapping model aliases (e.g. gpt-5-codex) to canonical pricing via LiteLLM’s dataset 5.
# Install and run in one command
npx @ccusage/codex@latest daily

# Monthly breakdown with per-model detail
npx @ccusage/codex@latest monthly --breakdown

# JSON export for CI pipelines
npx @ccusage/codex@latest monthly --json > usage-report.json
Strengths: Zero configuration, colourful terminal tables, JSON export for scripting, v18.0.11 with 109 releases indicating active maintenance 4.
Limitations: Codex data only available from September 2025 onward (when token_count events were introduced). Early sessions without turn_context metadata fall back to default GPT-5 pricing 5. No real-time quota tracking — it is a retrospective cost analyser only.
2. agentsview — The Session Intelligence Platform
agentsview takes a fundamentally different approach: it indexes all session data into a local SQLite database with FTS5 full-text search, then serves a Svelte-based web dashboard at http://127.0.0.1:8080 6. The claim of 100× faster queries than file-parsing tools holds up because repeated queries hit indexed SQLite rather than re-scanning JSONL on every invocation.
# Install
curl -fsSL https://agentsview.io/install.sh | bash

# Index all agents and launch dashboard
agentsview serve

# CLI cost report (ccusage replacement)
agentsview usage --agent codex --period monthly
The tool auto-discovers sessions from 16 agents including Codex CLI, Claude Code, Cursor, Copilot CLI, Gemini CLI, OpenCode, Amp, and Kiro 6. Session analytics include archetype classification (automation, quick, standard, deep, marathon) and tool/model mix analysis.
Strengths: Web UI with activity heatmaps and token charts, full-text search across all agent transcripts, Tauri desktop app, prompt-caching-aware cost calculations 6.
Limitations: Go binary (not available via npm), heavier footprint than ccusage for teams that only need cost reports.
3. OpenUsage — The Terminal Dashboard
OpenUsage occupies the middle ground: a Go-based terminal TUI that displays live quota percentages, spend, rate limits, and per-model usage across 17 providers 7. It auto-detects installed CLI tools and API keys, supports daemon mode for continuous background tracking, and stores historical data in SQLite.
# Install via Homebrew (macOS)
brew install janekbaraniewski/tap/openusage

# Or cross-platform
curl -fsSL https://github.com/janekbaraniewski/openusage/releases/latest/download/install.sh | bash

# Launch dashboard
openusage
Strengths: Real-time quota tracking (not just retrospective), 15+ built-in themes, daemon mode for continuous collection, covers both coding agents and raw API platforms (OpenAI, Anthropic, OpenRouter, Groq, Mistral, DeepSeek) 7.
Limitations: Terminal-only UI (no web dashboard), requires Go 1.25+ for source builds.
4. caut — The Universal Quota Monitor
caut (Coding Agent Usage Tracker) is a Rust CLI that fetches live usage data from 16+ providers by interrogating CLI tools, browser cookies, OAuth tokens, and APIs 8. Its provider-abstraction architecture means adding new agents requires implementing a single trait.
# Install from source
cargo install --git https://github.com/Dicklesworthstone/coding_agent_usage_tracker

# Check all providers
caut usage

# JSON output for agent consumption
caut usage --format json
Strengths: Widest provider support, dual-mode output (human-readable with colour bars or structured JSON/Markdown), zero configuration via auto-detection 8.
Limitations: Requires Rust 1.88+ toolchain, v0.1.0 maturity level — less battle-tested than ccusage.
5. Agent Sessions — The macOS Power Tool
Agent Sessions is a native Swift macOS app (requires macOS 14+) that reads session directories in read-only mode and provides a unified session browser with search, filtering, and resume capabilities 9. The Agent Cockpit feature shows live usage tracking for active iTerm2 sessions.
Strengths: Native macOS experience, session resume via right-click, cross-session transcript search, local-only with zero telemetry 9.
Limitations: macOS only, no cost analytics (session browsing focus), no CLI interface.
Decision Matrix
| Criterion | ccusage | agentsview | OpenUsage | caut | Agent Sessions |
|---|---|---|---|---|---|
| Primary focus | Cost reports | Session intelligence | Live quotas | Provider monitoring | Session browsing |
| Codex CLI support | ✅ Native | ✅ Native | ✅ Auto-detect | ✅ Auto-detect | ✅ Native |
| Real-time quotas | ❌ | ❌ | ✅ | ✅ | ⚠️ Active only |
| Web dashboard | ❌ | ✅ | ❌ | ❌ | ❌ |
| Full-text search | ❌ | ✅ | ❌ | ❌ | ✅ |
| JSON export | ✅ | ✅ | ✅ | ✅ | ❌ |
| Cross-platform | ✅ | ✅ | ✅ | ✅ | macOS only |
| Install | npx | curl | brew/curl | cargo | DMG |
Integrating with Codex CLI Workflows
Cost Gates in CI Pipelines
Combine ccusage JSON export with codex exec to enforce spend limits before merging:
#!/bin/bash
# pre-merge-cost-check.sh
MONTHLY_SPEND=$(npx @ccusage/codex@latest monthly --json | jq '.total_cost')
BUDGET=500.00

if (( $(echo "$MONTHLY_SPEND > $BUDGET" | bc -l) )); then
  echo "Monthly Codex spend (\$$MONTHLY_SPEND) exceeds budget (\$$BUDGET)"
  exit 1
fi
Session Search for Context Recovery
When resuming work on a feature branch, use agentsview to find the original session:
# Search all agent transcripts for a feature name
agentsview search "payment-gateway refactor" --agent codex --limit 5
Unified Reporting with OpenTelemetry
For teams already using Codex CLI’s OpenTelemetry integration 10, OpenUsage’s daemon mode can complement OTEL traces with quota and billing data that OTEL does not capture. The combination gives you both what the agent did (OTEL traces) and what it cost (OpenUsage metrics).
graph TB
    subgraph "Agent Execution"
        CX["Codex CLI"] -->|OTEL traces| OC["OTEL Collector"]
        CX -->|JSONL sessions| OU["OpenUsage daemon"]
    end
    subgraph "Observability Stack"
        OC --> GR["Grafana"]
        OU --> GR
        GR --> AL["Alerts:<br/>cost · latency · errors"]
    end
Codex CLI Session Data Internals
Understanding how Codex CLI stores session data helps when troubleshooting analytics tools. Sessions live at ~/.codex/sessions/<session-id>/events.jsonl 2. Each line is a JSON event with a type field. The key event types for usage analytics are:
token_count— Cumulative token totals (input, cached_input, output, reasoning) updated per turn 5turn_context— Identifies the active model, enabling per-model cost attribution 5tool_use— Records tool invocations (shell commands, file operations, MCP calls)
Analytics tools compute deltas between consecutive token_count events to determine per-turn consumption. This is why early September 2025 sessions (before token_count was introduced) show no cost data.
Customising the Session Directory
If you run multiple Codex CLI instances or keep sessions on a different volume, set CODEX_HOME:
export CODEX_HOME=/data/codex-sessions
All five analytics tools respect this environment variable 25.
Current Pricing Context
For context on what these tools are tracking, Codex CLI’s current credit rates per million tokens (as of April 2026) are 3:
| Model | Input | Cached Input | Output |
|---|---|---|---|
| GPT-5.5 | 125 credits | 12.50 credits | 750 credits |
| GPT-5.4 | 62.50 credits | 6.250 credits | 375 credits |
| GPT-5.4-mini | 18.75 credits | 1.875 credits | 113 credits |
| GPT-5.3-Codex | 43.75 credits | 4.375 credits | 350 credits |
The 10× discount on cached input tokens makes prompt caching awareness (as in agentsview) particularly valuable for accurate cost reporting 6.
Recommendations
Solo developer, cost-focused: Start with ccusage. One npx command, no install, immediate monthly reports.
Team lead, multi-agent stack: Deploy agentsview for its web dashboard and session intelligence. The SQLite indexing pays dividends as session history grows.
Enterprise, real-time governance: Run OpenUsage in daemon mode alongside your existing OTEL pipeline. The quota alerting prevents mid-sprint rate limit surprises.
Polyglot agent user, live monitoring: Use caut for its unmatched breadth of 16+ provider integrations from a single binary.
macOS power user: Add Agent Sessions alongside any of the above for native session browsing and resume workflows.
None of these tools are mutually exclusive. A practical combination for most Codex CLI power users is ccusage for quick cost checks plus agentsview for deep session analytics — covering both the “how much did I spend?” and “what did the agent actually do?” questions.