Codex CLI for Production Log Analysis: Root Cause Pipelines with codex exec, MCP Observability Servers, and Structured Triage Reports
Codex CLI for Production Log Analysis: Root Cause Pipelines with codex exec, MCP Observability Servers, and Structured Triage Reports
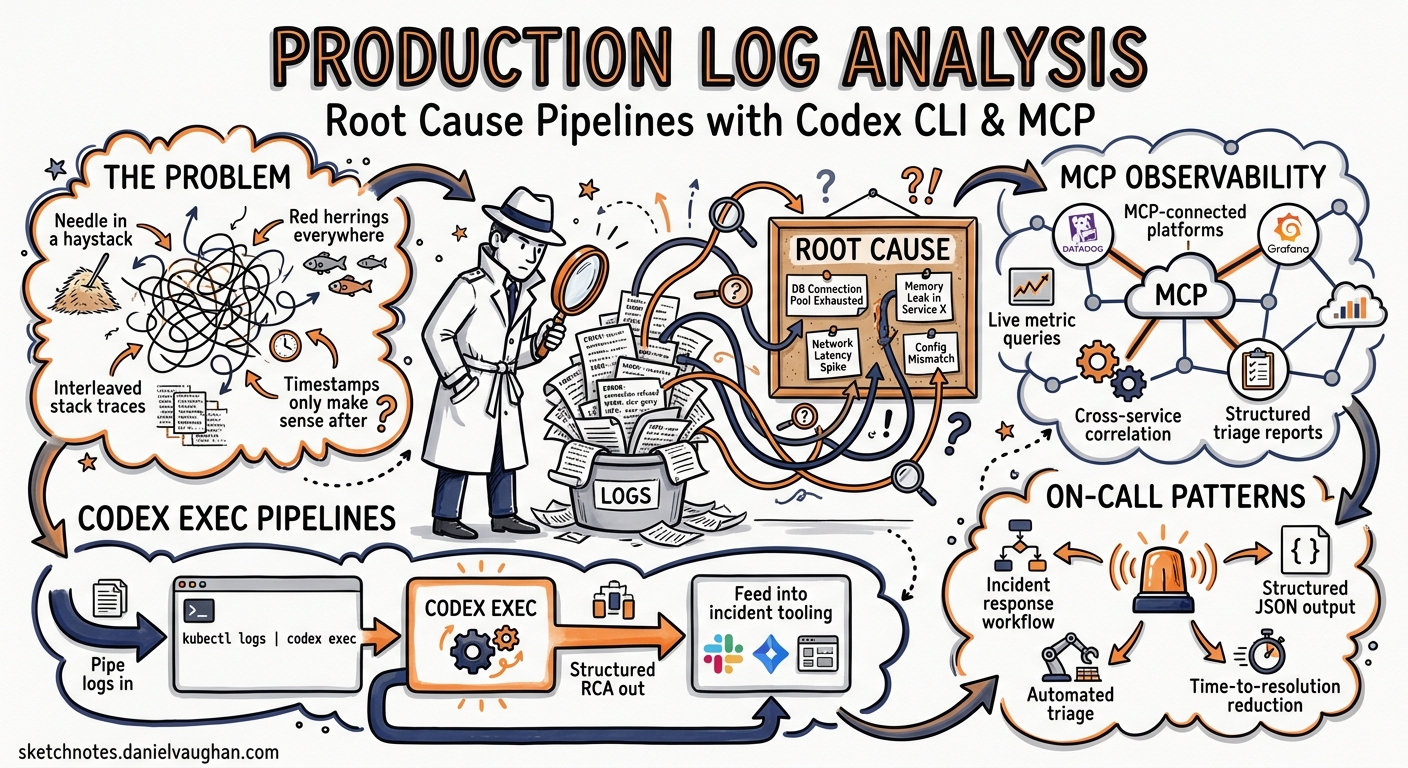
Production incidents rarely announce themselves with a single, readable error. They arrive as thousands of log lines across multiple services, peppered with red herrings, interleaved stack traces, and timestamps that only make sense once you already know the answer. Codex CLI — specifically its codex exec non-interactive mode — turns this needle-in-a-haystack problem into a composable pipeline: pipe logs in, get structured root cause analysis out, and feed the result into your incident response tooling.
This article covers the full surface area of using Codex CLI for production log triage: shell pipelines, MCP-connected observability platforms, structured output schemas, and practical patterns that fit into on-call workflows.
Why Codex CLI for Log Analysis?
Traditional log analysis tools excel at indexing and searching but struggle with interpretation. An SRE searching Kibana for ERROR still needs to read, correlate, and hypothesise. Codex CLI bridges the gap by treating log content as context for a reasoning model1.
The key capabilities that make this work:
- Prompt-plus-stdin: pipe log content directly into
codex execwhile providing analysis instructions as the prompt argument2 - Structured output: constrain the agent’s response to a JSON schema via
--output-schema, producing machine-readable triage reports2 - MCP integration: connect to Datadog, Grafana, and Loki MCP servers so the agent can pull live metrics and logs during analysis34
- Reasoning-token reporting:
codex exec --jsonnow reports reasoning-token usage, letting you measure the cost of each analysis run5
Basic Pipeline: Piping Logs into codex exec
The simplest pattern pipes a log tail directly into codex exec:
tail -n 500 /var/log/app/production.log \
  | codex exec "Identify the root cause of any errors in these logs. \
    Cite specific log lines. Suggest three debugging steps." \
  > triage-report.md
Codex treats the piped content as additional context alongside the prompt instruction2. Progress streams to stderr; the final analysis goes to stdout. This separation means you can redirect the report without capturing noise.
For larger log files, pre-filter before piping to stay within context window limits:
grep -A5 "ERROR\|FATAL\|Exception" /var/log/app/production.log \
  | tail -n 300 \
  | codex exec "Correlate these error patterns. Which errors are symptoms \
    and which is the root cause? Present a timeline." \
  > correlation-report.md
Multi-Service Log Correlation
When an incident spans multiple services, concatenate filtered logs with service markers:
{
  echo "=== payment-service ==="
  grep "ERROR" /var/log/payment/app.log | tail -n 100
  echo "=== order-service ==="
  grep "ERROR" /var/log/order/app.log | tail -n 100
  echo "=== gateway ==="
  grep "5[0-9][0-9]" /var/log/nginx/error.log | tail -n 50
} | codex exec "These are error logs from three services during an incident \
  at approximately 14:30 UTC. Identify the originating failure, the propagation \
  path, and the downstream effects. Output a timeline." \
  > multi-service-triage.md
Structured Output with –output-schema
Free-text triage reports are useful for humans but awkward for automation. The --output-schema flag constrains the agent’s response to a JSON Schema, producing output that downstream tools can parse reliably2.
Define a schema for incident triage:
{
  "$schema": "https://json-schema.org/draft/2020-12/schema",
  "type": "object",
  "properties": {
    "root_cause": {
      "type": "string",
      "description": "Single-sentence root cause hypothesis"
    },
    "confidence": {
      "type": "string",
      "enum": ["high", "medium", "low"]
    },
    "evidence": {
      "type": "array",
      "items": {
        "type": "object",
        "properties": {
          "log_line": { "type": "string" },
          "service": { "type": "string" },
          "timestamp": { "type": "string" },
          "relevance": { "type": "string" }
        },
        "required": ["log_line", "service", "relevance"],
        "additionalProperties": false
      }
    },
    "timeline": {
      "type": "array",
      "items": {
        "type": "object",
        "properties": {
          "time": { "type": "string" },
          "event": { "type": "string" },
          "service": { "type": "string" }
        },
        "required": ["time", "event"],
        "additionalProperties": false
      }
    },
    "next_steps": {
      "type": "array",
      "items": { "type": "string" }
    },
    "severity": {
      "type": "string",
      "enum": ["critical", "high", "medium", "low"]
    }
  },
  "required": ["root_cause", "confidence", "evidence", "timeline", "next_steps", "severity"],
  "additionalProperties": false
}
Run the analysis with schema enforcement:
tail -n 500 /var/log/app/production.log \
  | codex exec "Analyse these production logs and produce a structured \
    incident triage report." \
    --output-schema ./triage-schema.json \
    -o ./incident-2026-05-01.json
The resulting JSON can feed directly into PagerDuty, Jira, or a custom incident dashboard.
Known limitation:
--output-schemais silently ignored when MCP servers or tools are active in the session6. If you need both MCP context and structured output, run the analysis in two passes — first gather context via MCP, then pipe the findings into a secondcodex execcall with--output-schema.
MCP-Connected Observability: Datadog, Grafana, and Loki
Piping local log files works for simple cases, but production incidents often require correlating logs with metrics, traces, and alerts. MCP servers from Datadog and Grafana bring observability data directly into the agent’s context.
Datadog MCP Server
The Datadog MCP Server went GA on 10 March 2026 as a remote server — no local installation required3. It exposes 16+ tools covering logs, APM traces, error tracking, alerting, and infrastructure metrics.
Configure it in ~/.codex/config.toml:
[mcp_servers.datadog]
type = "remote"
url = "https://mcp.datadoghq.com/sse"
headers = { "DD-API-KEY" = "${DD_API_KEY}", "DD-APPLICATION-KEY" = "${DD_APP_KEY}" }
With Datadog connected, you can ask Codex to pull live context during analysis:
codex exec "Investigate the spike in 500 errors on payment-service \
  between 14:00 and 14:30 UTC today. Query Datadog for related logs, \
  APM traces, and infrastructure metrics. Identify the root cause \
  and suggest a fix."
The agent will call Datadog’s MCP tools — search_logs, get_trace, get_metric_timeseries — to gather evidence before producing its analysis3.
Grafana and Loki MCP Servers
Grafana maintains two complementary MCP servers: mcp-grafana for dashboards, alerting, and Prometheus metrics, and loki-mcp for deep log querying via LogQL4.
[mcp_servers.grafana]
type = "stdio"
command = "npx"
args = ["-y", "@grafana/mcp-grafana"]
env = { "GRAFANA_URL" = "https://grafana.internal.example.com", "GRAFANA_API_KEY" = "${GRAFANA_API_KEY}" }

[mcp_servers.loki]
type = "stdio"
command = "npx"
args = ["-y", "@grafana/loki-mcp"]
env = { "LOKI_URL" = "https://loki.internal.example.com", "LOKI_API_KEY" = "${LOKI_API_KEY}" }
The Loki MCP server supports querying logs via LogQL, retrieving label values, and identifying log patterns — detected automatically by Loki to surface common log structures and anomalies4.
codex exec "Query Loki for all error-level logs from the checkout \
  service in the last hour. Cross-reference with Grafana alerting \
  to identify any triggered alerts. Produce a root cause analysis."
Architecture: Two-Pass Pattern for MCP + Structured Output
Because --output-schema is silently ignored when MCP tools are active6, use a two-pass approach:
flowchart LR
    A[Pass 1: MCP Context Gathering] --> B[Intermediate Findings]
    B --> C[Pass 2: Structured Report]

    A -- "codex exec with MCP servers" --> B
    B -- "pipe into codex exec --output-schema" --> C
# Pass 1: Gather context from observability tools
codex exec "Query Datadog for error logs and APM traces from \
  payment-service between 14:00-14:30 UTC. Summarise findings \
  as a plain-text evidence brief." > /tmp/evidence.txt

# Pass 2: Produce structured report from evidence
cat /tmp/evidence.txt \
  | codex exec "Convert this evidence brief into a structured \
    incident triage report." \
    --output-schema ./triage-schema.json \
    -o ./incident-report.json
Practical On-Call Integration
Automated Triage on Alert
Wire log analysis into your alerting pipeline. When PagerDuty fires, a webhook triggers a script that:
- Pulls recent logs from the affected service
- Runs
codex execwith the triage schema - Posts the structured report back to the incident channel
#!/usr/bin/env bash
# on-call-triage.sh — triggered by PagerDuty webhook
SERVICE="$1"
WINDOW_MINS="${2:-30}"

# Pull logs from the last N minutes
journalctl -u "$SERVICE" --since "-${WINDOW_MINS}min" --no-pager \
  | codex exec "Triage these logs for service $SERVICE. \
    Identify the root cause, severity, and recommended next steps." \
    --output-schema ./triage-schema.json \
    -o "/tmp/triage-${SERVICE}-$(date +%s).json" \
    --ephemeral

# Post to Slack via webhook
jq -r '"*Root Cause*: \(.root_cause)\n*Severity*: \(.severity)\n*Confidence*: \(.confidence)\n*Next Steps*:\n\(.next_steps | map("- " + .) | join("\n"))"' \
  "/tmp/triage-${SERVICE}-$(date +%s).json" \
  | curl -X POST -H 'Content-type: application/json' \
    --data "{\"text\": \"$(cat -)\"}" \
    "$SLACK_WEBHOOK_URL"
Cost-Aware Analysis with Reasoning-Token Tracking
Since v0.125.0, codex exec --json reports reasoning-token usage alongside completion tokens5. For log analysis — which can involve large context — tracking this prevents cost surprises:
tail -n 500 /var/log/app/production.log \
  | codex exec --json "Triage these logs" 2>/dev/null \
  | jq 'select(.type == "turn.completed") | .usage'
Sample output:
{
  "input_tokens": 12847,
  "output_tokens": 1523,
  "reasoning_tokens": 4096,
  "cached_input_tokens": 8192
}
The reasoning_tokens field reveals how much “thinking” the model spent. For routine triage, consider lowering reasoning effort:
codex exec -c 'model_reasoning_effort="medium"' \
  "Triage these logs" < /var/log/app/production.log
AGENTS.md Template for Incident Response Repositories
If your team maintains a dedicated incident response repository, add an AGENTS.md that primes the agent for log analysis:
# AGENTS.md — Incident Response Repository

## Context
This repository contains incident post-mortems, runbooks, and triage
automation scripts.

## When analysing logs
- Always produce a timeline of events
- Distinguish root cause from symptoms
- Cite specific log lines as evidence
- Rate confidence: high, medium, or low
- Suggest concrete next steps, not generic advice

## Service topology
- gateway → order-service → payment-service → ledger-db
- All services log to /var/log/{service}/app.log
- Metrics are in Datadog; logs are in Grafana Loki

## Style
- Use ISO 8601 timestamps
- Refer to services by their deployment name
- Be terse — on-call engineers are reading this at 3 AM
Model Selection for Log Analysis
Not every log triage task needs GPT-5.5. Match the model to the complexity:
| Task | Recommended Model | Reasoning Effort |
|---|---|---|
| Simple grep + summarise | gpt-5.4-mini |
low |
| Multi-service correlation | gpt-5.4 |
medium |
| Complex distributed system RCA | gpt-5.5 |
high |
| Quick error count and categorise | gpt-5.4-mini |
low |
| Post-mortem draft from logs | gpt-5.5 |
medium |
Configure profiles for different triage scenarios:
[profiles.quick-triage]
model = "gpt-5.4-mini"
model_reasoning_effort = "low"

[profiles.deep-rca]
model = "gpt-5.5"
model_reasoning_effort = "high"
# Quick triage
tail -n 100 app.log | codex exec --profile quick-triage "summarise errors"

# Deep root cause analysis
cat full-incident-logs.txt | codex exec --profile deep-rca \
  "Full root cause analysis with timeline and evidence"
Limitations and Caveats
- Context window limits: GPT-5.5 supports up to 1M tokens of context7, but piping 50,000 log lines is wasteful. Pre-filter with
grep,awk, orjqbefore piping. - Schema + MCP conflict:
--output-schemais silently ignored when MCP tools are active6. Use the two-pass pattern described above. - No streaming analysis:
codex execprocesses the entire input before responding. For real-time log monitoring, usecodex execin a cron loop or wire it into a log aggregator’s alerting pipeline. - Hallucination risk: the model may invent plausible-sounding root causes from ambiguous logs. Always verify the cited log lines exist in the original output. Lower reasoning effort can increase tool hallucination rates8.
- Cost accumulation: large log files consume significant input tokens. A 500-line log at ~10 tokens per line is ~5,000 input tokens — manageable. A 50,000-line dump is not. ⚠️ Monitor reasoning-token usage with
--jsonto avoid billing surprises.
Citations
-
OpenAI, “Codex CLI”, developers.openai.com/codex/cli, accessed 2026-05-01 ↩
-
OpenAI, “Non-interactive mode — Codex”, developers.openai.com/codex/noninteractive, accessed 2026-05-01 ↩ ↩2 ↩3 ↩4
-
Datadog, “OpenAI + Datadog: Codex CLI integration for AI-assisted DevOps”, datadoghq.com/blog/openai-datadog-ai-devops-agent, accessed 2026-05-01 ↩ ↩2 ↩3
-
Grafana Labs, “MCP server for Grafana / Loki MCP”, github.com/grafana/mcp-grafana and github.com/grafana/loki-mcp, accessed 2026-05-01 ↩ ↩2 ↩3
-
OpenAI, “Codex Changelog — v0.125.0 (April 2026)”, developers.openai.com/codex/changelog, accessed 2026-05-01 ↩ ↩2
-
openai/codex Issue #15451, “–json and –output-schema are silently ignored when tools/MCP servers are active”, github.com/openai/codex/issues/15451, accessed 2026-05-01 ↩ ↩2 ↩3
-
OpenAI, “Introducing GPT-5.4”, openai.com/index/introducing-gpt-5-4, March 2026 ↩
-
“The Reasoning Trap: Why Higher Reasoning Effort Increases Tool Hallucination”, Codex Blog, codex.danielvaughan.com/2026/04/29/reasoning-trap-tool-hallucination-codex-cli-reasoning-effort-defence, 2026-04-29 ↩