codex doctor: The Diagnostics Command That Replaces Manual Log Archaeology
codex doctor: The Diagnostics Command That Replaces Manual Log Archaeology
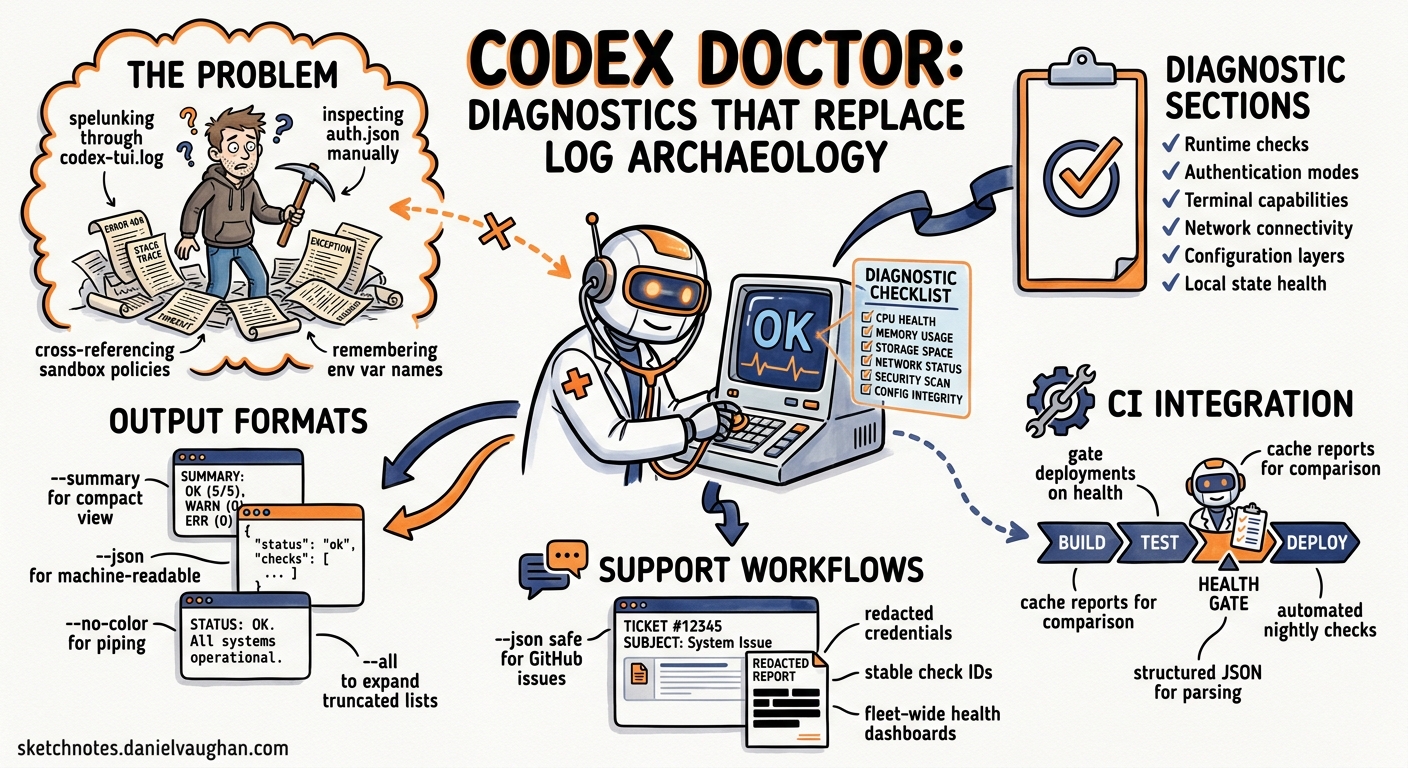
Before Codex CLI v0.131.0, diagnosing a broken installation meant spelunking through ~/.codex/log/codex-tui.log, manually inspecting auth.json token expiry, cross-referencing sandbox policy files, and hoping you remembered which environment variable controlled which behaviour12. The new codex doctor command collapses all of that into a single, structured diagnostic report covering runtime, authentication, terminal, network, configuration, and local state34.
This article walks through every diagnostic section, explains the flags that control output format, and shows how to integrate codex doctor into CI pipelines and support workflows.
Why a dedicated diagnostics command?
Codex CLI’s surface area has grown substantially. A typical installation now involves:
- Multiple authentication modes (API key, ChatGPT browser PKCE, device-code flow)5
- MCP server connections with OAuth and Streamable HTTP transport6
- Sandbox policies governed by both local
config.tomland enterpriserequirements.toml7 - Plugin marketplace installations with hook bindings8
- An app-server daemon managing background sessions3
When something breaks, the failure could originate in any of these layers. codex doctor systematically checks each one and surfaces anomalies in a promoted Notes block at the top of its output4.
Running the command
# Full detailed output (default)
codex doctor

# Compact summary view
codex doctor --summary

# Machine-readable JSON (redacted for safe sharing)
codex doctor --json

# Expand truncated lists
codex doctor --all

# Strip ANSI colours for piping/logging
codex doctor --no-color
The --json flag is particularly important for support workflows. It produces a structured, redacted report keyed by stable check IDs, making it safe to attach to GitHub issues without leaking credentials4.
Diagnostic sections
The report is organised into five sections, each containing multiple checks. Every check reports a status: ok, idle, note, warning, or fail4.
flowchart TD
    A[codex doctor] --> B[Notes]
    A --> C[Environment]
    A --> D[Configuration]
    A --> E[Updates]
    A --> F[Connectivity]
    A --> G[Background Server]

    B --> B1[Promoted anomalies]
    C --> C1[Runtime provenance]
    C --> C2[Install consistency]
    C --> C3[Search tool availability]
    C --> C4[Terminal metadata]
    C --> C5[Database health]
    D --> D1[config.toml parse status]
    D --> D2[Auth mode details]
    D --> D3[MCP server config]
    D --> D4[Sandbox policy]
    D --> D5[Feature flags]
    E --> E1[Update cache state]
    E --> E2[Latest version check]
    F --> F1[WebSocket handshake]
    F --> F2[HTTP endpoint reachability]
    F --> F3[Provider-specific checks]
    G --> G1[App-server daemon status]
    G --> G2[SQLite integrity]
    G --> G3[Rollout statistics]
1. Notes
The Notes block appears first and promotes the most actionable findings from all other sections. Typical entries include:
- Available update — a newer CLI version exists but hasn’t been applied
- Large rollout directory — accumulated rollout traces consuming significant disc space
- Optional MCP failures — an MCP server marked optional is unreachable
- Mixed auth signals — conflicting authentication modes detected (e.g. both an API key and a ChatGPT browser session active simultaneously)4
2. Environment
This section validates the runtime foundation:
| Check | What it verifies |
|---|---|
| Runtime provenance | Node.js version, installation method (npm global, npx, Homebrew) |
| Install consistency | Whether the binary matches the expected package version; detects npm-managed installs on Windows correctly3 |
| Search readiness | Availability of bundled and system search tools (ripgrep, fd) used by @ mentions and file context |
| Terminal metadata | $TERM value, tmux/zellij detection, multiplexer configuration that affects TUI rendering |
| Database health | SQLite integrity checks on state and log databases4 |
The install consistency check is worth highlighting. A common support issue arises when developers have multiple Node.js version managers (nvm, fnm, volta) and the global codex binary resolves to a stale installation. codex doctor detects this mismatch directly4.
3. Configuration
Configuration diagnostics parse and validate the active configuration stack:
- config.toml parse status — reports syntax errors with line numbers rather than silent fallback behaviour
- Authentication mode — identifies the active auth method and warns about conflicting signals5
- MCP server configuration — lists configured servers and their transport types, flagging unreachable optional servers and policy violations against
requirements.toml67 - Sandbox policy — reports the effective sandbox mode, network access settings, and filesystem write permissions
- Feature flags — lists enabled flags and any overrides applied via environment variables or config4
4. Updates
A straightforward section checking:
- Whether the local update cache is stale
- The latest available version from the npm registry
- Whether the current version is behind and by how many releases3
5. Connectivity
Provider-aware network validation is where codex doctor earns its keep for enterprise environments:
# Example connectivity output (abbreviated)
Connectivity
  WebSocket handshake ........... ok  (upgrade 101 in 43ms)
  API endpoint (api.openai.com) . ok  (200 in 112ms)
  ChatGPT auth .................. idle (no browser session)
  Azure OpenAI .................. idle (not configured)
  Custom provider ............... idle (not configured)
The command tests WebSocket connectivity with HTTP upgrade status reporting, then checks reachability for each configured provider endpoint4. Behind a corporate proxy, this immediately reveals whether the issue is DNS, TLS interception, or endpoint blocking — information that previously required separate curl and wscat commands.
6. Background Server
The final section inspects the app-server daemon:
- Daemon status — running, stopped, or crashed with PID and uptime
- SQLite integrity — validates the session database hasn’t been corrupted by unclean shutdowns
- Rollout statistics — active and archived rollout file counts, total disc usage, and average trace sizes49
Integrating with support workflows
Attaching to GitHub issues
The --json output is designed for safe sharing. Credentials, tokens, and sensitive configuration values are automatically redacted:
# Generate a redacted report and copy to clipboard
codex doctor --json | pbcopy
Paste the output directly into a GitHub issue. The OpenAI support team can parse the stable check IDs programmatically4.
Automatic attachment via /feedback
When you run /feedback inside a Codex session, the system now automatically attaches a redacted codex-doctor-report.json to the log upload. It also derives Sentry tags for the overall status and any failing checks, enabling the support team to triage issues before reading the full report4.
CI pipeline health checks
For teams running codex exec in CI/CD pipelines, a pre-flight codex doctor check catches configuration drift before it causes cryptic task failures:
#!/usr/bin/env bash
# ci-preflight.sh — run before codex exec in CI

set -euo pipefail

DOCTOR_OUTPUT=$(codex doctor --json --no-color)
STATUS=$(echo "$DOCTOR_OUTPUT" | jq -r '.overall_status')

if [ "$STATUS" = "fail" ]; then
  echo "::error::codex doctor reported failures:"
  echo "$DOCTOR_OUTPUT" | jq '.checks[] | select(.status == "fail")'
  exit 1
fi

echo "codex doctor: $STATUS"
This pattern is particularly valuable after Codex CLI version upgrades, where configuration schema changes can silently break config.toml parsing510.
Enterprise fleet diagnostics
For organisations using managed configuration via requirements.toml, codex doctor reports which managed-configuration layer is active on a developer’s machine7. Combined with --json, this enables fleet-wide health aggregation:
# Collect diagnostics across developer machines
codex doctor --json > "/shared/diagnostics/$(hostname)-$(date +%Y%m%d).json"
Relationship to other diagnostic tools
codex doctor doesn’t replace existing diagnostic surfaces — it complements them:
| Tool | Scope | When to use |
|---|---|---|
codex doctor |
System-wide health snapshot | Installation issues, auth problems, pre-support triage |
/feedback |
Session-specific diagnostics | Mid-session errors, request IDs for server-side logs |
/debug-config |
Active configuration layers | Config precedence confusion during a session11 |
codex debug |
Rollout trace reduction | Inspecting recorded tool/session/multi-agent traces9 |
~/.codex/log/codex-tui.log |
Detailed event logs | Stack traces, error sequences, timing analysis1 |
flowchart LR
    subgraph Pre-session
        A[codex doctor] --> B{Issue found?}
        B -->|Yes| C[Fix config/auth/network]
        B -->|No| D[Start session]
    end
    subgraph In-session
        D --> E[/feedback for session issues]
        D --> F[/debug-config for config questions]
    end
    subgraph Post-session
        G[codex debug] --> H[Trace analysis]
        I[codex-tui.log] --> J[Event archaeology]
    end
Common diagnostic patterns
“Codex won’t authenticate” — Run codex doctor and check the Configuration section for mixed auth signals. A common cause is having both OPENAI_API_KEY set in the environment and an active ChatGPT browser session, causing ambiguous provider resolution45.
“MCP server won’t connect” — The Connectivity section tests each configured MCP server endpoint. Check for fail status entries showing HTTP error codes or timeout durations. Cross-reference with the Configuration section’s MCP server list to confirm the transport type matches what the server expects6.
“TUI renders incorrectly in tmux” — The Environment section reports terminal metadata including $TERM value and multiplexer detection. Incorrect $TERM settings under tmux (e.g. xterm instead of tmux-256color) cause rendering artefacts that codex doctor flags as a note4.
“CI pipeline failures after upgrade” — Run the CI preflight script above. The Updates section shows version drift, whilst Configuration catches schema changes in config.toml that the new version doesn’t parse cleanly10.
Limitations
codex doctor examines the local client state. It cannot diagnose:
- Server-side rate limiting or capacity issues (use
/feedbackrequest IDs for these) - Codex Cloud task failures (use the Codex Cloud dashboard)
- Model-specific behaviour differences (use
codex execwith--output-schemafor reproducible testing)5
⚠️ The codex doctor documentation page has not yet appeared on the official CLI reference at the time of writing, though the command is functional in v0.131.0+ and the PR implementing it has been merged4.
Citations
-
SmartScope, “Codex CLI Logs: Location, Debug Flags & 401 Error Fix (2026),” May 2026. https://smartscope.blog/en/generative-ai/chatgpt/codex-cli-diagnostic-logs-deep-dive/ ↩ ↩2
-
Milvus AI Quick Reference, “How do I troubleshoot errors or issues when using Codex CLI?” 2026. https://milvus.io/ai-quick-reference/how-do-i-troubleshoot-errors-or-issues-when-using-codex-cli ↩
-
OpenAI, “Changelog — Codex CLI v0.131.0,” May 18, 2026. https://developers.openai.com/codex/changelog ↩ ↩2 ↩3 ↩4
-
GitHub Pull Request #22336, “feat(cli): add codex doctor diagnostics,” openai/codex, May 2026. https://github.com/openai/codex/pull/22336 ↩ ↩2 ↩3 ↩4 ↩5 ↩6 ↩7 ↩8 ↩9 ↩10 ↩11 ↩12 ↩13 ↩14 ↩15
-
OpenAI, “Codex CLI v0.132.0 Changelog — Python SDK Authentication,” May 20, 2026. https://developers.openai.com/codex/changelog ↩ ↩2 ↩3 ↩4 ↩5
-
OpenAI, “MCP Server Management — Codex CLI,” 2026. https://developers.openai.com/codex/cli ↩ ↩2 ↩3
-
OpenAI, “Codex CLI Features — Managed Configuration,” 2026. https://developers.openai.com/codex/cli/features ↩ ↩2 ↩3
-
OpenAI, “Codex CLI Command Line Options — Plugin Marketplace,” 2026. https://developers.openai.com/codex/cli/reference ↩
-
GitHub Pull Request #18880, “Add debug trace reduction command,” openai/codex, 2026. https://github.com/openai/codex/pull/18880 ↩ ↩2
-
Uniflow, “Codex CLI Install Troubleshooting — Setup Error Fixes,” 2026. https://www.uniflow.kr/en/codex-cli-install-setup-troubleshooting-guide/ ↩ ↩2
-
OpenAI, “Codex CLI Slash Commands Reference,” 2026. https://developers.openai.com/codex/cli/reference ↩