Inside the Black Box: Codex CLI v0.165.0's Observability Sprint
Inside the Black Box: Codex CLI v0.165.0’s Observability Sprint
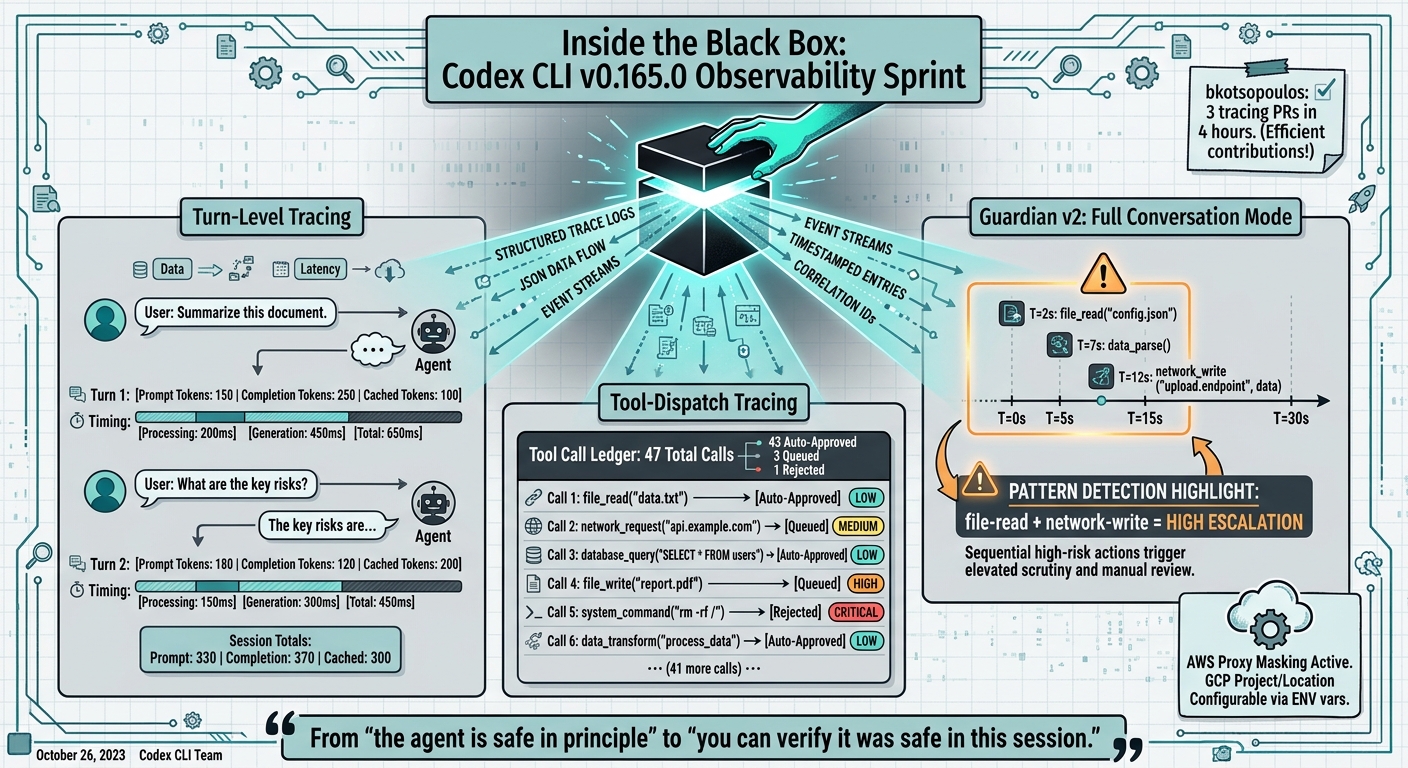
Release track: v0.165.0-alpha.1 (23 October 2026, 14:09 UTC) Previous stable: v0.164.0 (23 October 2026, 04:48 UTC) Theme: Observability, Guardian v2, multi-cloud credential expansion Sprint author (tracing): bkotsopoulos — three tracing PRs in the first four hours
Twelve hours after v0.164.0 shipped as stable, the v0.165.0 alpha sprint opened. The first commit landed at 14:09 UTC on 23 October. Within four hours, three pull requests from a single engineer had established the theme for the new sprint: you should be able to see what Codex is doing.
This is a different kind of feature work from the sprint that produced v0.164.0. The MCP authentication overhaul and zero-trust security primitives were foundational infrastructure. The observability work starting in v0.165.0-alpha.1 is about surfacing that infrastructure: making Codex’s internal operation legible to developers, operators, and audit tools.
Why Observability Now
The timing makes sense if you understand what v0.164.0 introduced. Ephemeral agent registration, signed capability assertions, Guardian hardening, enterprise MCP auth with structured authority checks — these are all systems that produce rich internal state. An agent makes a file write request. Guardian classifies it. The ephemeral token chain is validated. The signed assertion is logged. All of that happened in v0.164.0.
What v0.164.0 did not provide was a way to read any of it in real time. The signed assertions exist in internal logs. The Guardian classification decisions happen inside the process. The token chain is verifiable in principle, but not something a developer could inspect during a running session.
v0.165.0’s observability sprint is the work of exposing what v0.164.0 built.
Turn-Level Tracing
The first PR from bkotsopoulos introduces turn-level tracing: a structured record of each conversation turn, emitted as a trace event that can be observed externally.
A turn trace captures:
- The turn index within the session
- The input to the model for that turn (after context preparation)
- The output from the model
- Timing: when the turn started, when the first token arrived, when the turn completed
- Token counts: prompt tokens, completion tokens, cached tokens used
This is the data that was previously available only via OpenAI’s API usage dashboard — aggregate token counts per session, billed after the fact. Turn-level tracing makes the same data available within the session, with per-turn granularity, in real time.
Why this matters in practice:
If you have ever watched a Codex session consume far more tokens than expected and had no idea which part of the conversation was responsible, turn-level tracing gives you the answer. The token-spike incident that ran for 72+ hours without official acknowledgement — 2.5 billion tokens, 7x baseline — is exactly the kind of anomaly that turn-level tracing would have caught at the first anomalous turn rather than days later via billing.
Streaming Tracing
The second PR extends tracing to the streaming layer: streaming tracing records the token-by-token progress of model output, including stalls, resumptions, and interruptions.
Streaming tracing captures:
- First-token latency (time from turn start to first token received)
- Inter-token latency distribution (are tokens arriving evenly, or is there a mid-stream stall?)
- Streaming interruptions: did the stream halt? Was it a network issue, a mid-prompt injection, or a Guardian intervention?
- Stream completion type: natural end-of-response vs. tool call trigger vs. interrupted by user input
The streaming interrupt regression in v0.163.0 — where sending a follow-up prompt mid-stream caused the stream to terminate, rather than the intended steering behaviour — is precisely the failure mode that streaming tracing is designed to surface. With streaming tracing, the interruption event would be visible in the trace: type user-interrupt, followed by an abrupt completion, followed by no resumption. That trace would have made the bug immediately reproducible and diagnosable, rather than requiring community reports to establish the pattern.
Tool-Dispatch Tracing
The third PR from bkotsopoulos is tool-dispatch tracing: a record of every tool call made during a session, including Guardian’s classification decision for each call.
A tool-dispatch trace event includes:
- The tool called (file read, file write, shell command, MCP tool, etc.)
- The parameters passed to the tool
- Guardian’s risk classification (low, medium, high, critical)
- The approval outcome (auto-approved, queued for user approval, rejected)
- If queued: the time spent waiting for user approval
- The tool call result and exit code
This is the observability layer that makes Guardian’s decisions auditable. Before tool-dispatch tracing, Guardian’s risk classifications happened inside the process and were only visible if Codex explicitly surfaced them in the TUI (which it did for queued approvals, but not for auto-approved low-risk calls). The vast majority of tool calls — the routine file reads and writes that flow through without a prompt — were invisible in any post-session audit.
With tool-dispatch tracing, every tool call leaves a record. An operator reviewing a session log after the fact can see: the agent made 47 tool calls; 43 were auto-approved low-risk; 3 were queued for user approval; 1 was rejected by Guardian. The rejection was a file write to a path in .env*. That single line in a tool-dispatch trace log is an audit record.
Guardian v2: Full Conversation Mode
Alongside the tracing work, v0.165.0-alpha.1 includes the completion of Guardian v2’s full conversation mode — a significant expansion of what Guardian can assess.
Guardian in v0.164.0 classified individual capability requests: a single tool call, evaluated against its risk tier. What it could not do was assess the sequence of capability requests over the course of a session.
Guardian v2’s full conversation mode changes this. Guardian now maintains a rolling view of the session’s tool-call history and uses that context when classifying new requests. The practical effect:
Pattern-based escalation: A sequence of actions that would each individually be low-risk can be classified as a higher-risk pattern. The example documented in the v0.164.0 release — file read followed by network write to an external endpoint — now triggers a pattern-based escalation to high risk, even though each individual action is low or medium risk.
Constraint violation detection: If AGENTS.md specifies a constraint (do not write to src/auth/), Guardian v2 can now cross-reference tool-dispatch traces against AGENTS.md content. A write to src/auth/tokens.ts will trigger a Guardian alert even if it would otherwise be classified as a low-risk file write, because the constraint makes it a policy violation.
This last capability is architecturally significant: it is the beginning of a real enforcement mechanism for AGENTS.md constraints, rather than relying solely on the model’s instruction-following to honour them. The acknowledge-apologise-re-violate failure pattern in GPT-6.1 Sol is precisely the scenario that Guardian v2 constraint enforcement is designed to catch at the system level, rather than hoping the model catches it at the instruction level.
Multi-Cloud Credential Expansion
v0.165.0-alpha.1 also continues the credential infrastructure work that was partly visible in v0.164.0’s Bedrock default-on:
GCP project and location configurable: Vertex AI integration now exposes project ID and location as explicit configuration parameters rather than environment variable lookups. Teams running Codex against GCP resources can now pin the project and region in ~/.codex/config.json, preventing the session-to-session inconsistency that occurred when GOOGLE_CLOUD_PROJECT was not set.
AWS proxy credential masking: Codex sessions routed through AWS proxy configurations now have credential masking applied to the proxy layer, consistent with the masking applied to direct AWS credential use. This closes a gap where credentials could appear in trace logs when routed through an intermediary.
Together with the Bedrock default-on and credential selection improvements from v0.164.0-alpha.11, these changes suggest that multi-cloud credential management is a sustained sprint theme in v0.165.0, not a one-off fix.
What Comes Next in This Sprint
Three tracing PRs in the first four hours of a sprint is a signal about velocity and priority. The pattern in v0.164.0’s alpha sprint — focused feature batches from specific engineers establishing a theme in the first day — suggests the observability sprint will follow a similar trajectory.
Based on the alpha.1 foundations, the likely next steps are:
-
Trace export format: The tracing infrastructure needs an export mechanism before it is useful outside the Codex process itself. Likely candidates: structured JSON log files, OpenTelemetry-compatible format, or direct integration with existing observability platforms.
-
Guardian v2 policy-as-code: The constraint violation detection in Guardian v2 is currently tied to AGENTS.md parsing. A policy-as-code format — a declarative configuration specifying which tool-call patterns trigger which Guardian responses — would make enterprise security policy portable and version-controllable.
-
Sub-agent privilege scoping: The ephemeral registration parent chain from v0.164.0 enables privilege scoping (restricting a sub-agent’s capabilities to a subset of the parent session). This was flagged as missing in the v0.164.0 article. The full-conversation Guardian mode is likely a prerequisite, which is now in place.
-
Message-board primitives for inter-agent coordination: Multiple community tools (ctx-kit, estafeta) have built handoff mechanisms on top of files and prompts because Codex CLI has no native inter-agent communication channel. There are hints in the v0.165.0 commit metadata of work towards a structured message-passing primitive — though this is speculative until commits land.
Using the Tracing Features in Alpha.1
The tracing features in v0.165.0-alpha.1 are developer-facing rather than end-user-facing in this initial form. To access them:
npm install -g @openai/codex@0.165.0-alpha.1
Enable trace output in your configuration:
{
  "tracing": {
    "enabled": true,
    "level": "tool-dispatch",
    "output": "~/.codex/traces/"
  }
}
Trace levels: turn (least verbose), streaming, tool-dispatch (most verbose). Tool-dispatch includes turn and streaming data.
Alpha builds are not recommended for production use. If you are evaluating the tracing features, test against a non-production codebase and review the trace output format — it may change as the sprint progresses.
The Bigger Picture
The arc from v0.164.0 to v0.165.0 is the arc from building the infrastructure to making it visible. v0.164.0 introduced signed assertions, ephemeral registration, Guardian hardening — all internal systems that produced rich data but kept it internal. v0.165.0’s first day establishes that the data is now supposed to be external.
This matters beyond feature announcements. One of the consistent criticisms of AI coding agents in enterprise contexts is: we have no idea what the agent did. Signed assertions and ephemeral registration were the first answer to that criticism. Turn-level tracing, streaming tracing, and tool-dispatch tracing are the second answer: not just that the data is recorded, but that you can read it.
That is the shift from “the agent is safe in principle” to “you can verify that the agent was safe in this specific session.” The second claim is the one that enterprise security teams can act on.