Codex CLI + Datadog MCP Server: Observability-Driven Development from Your Terminal
Codex CLI + Datadog MCP Server: Observability-Driven Development from Your Terminal
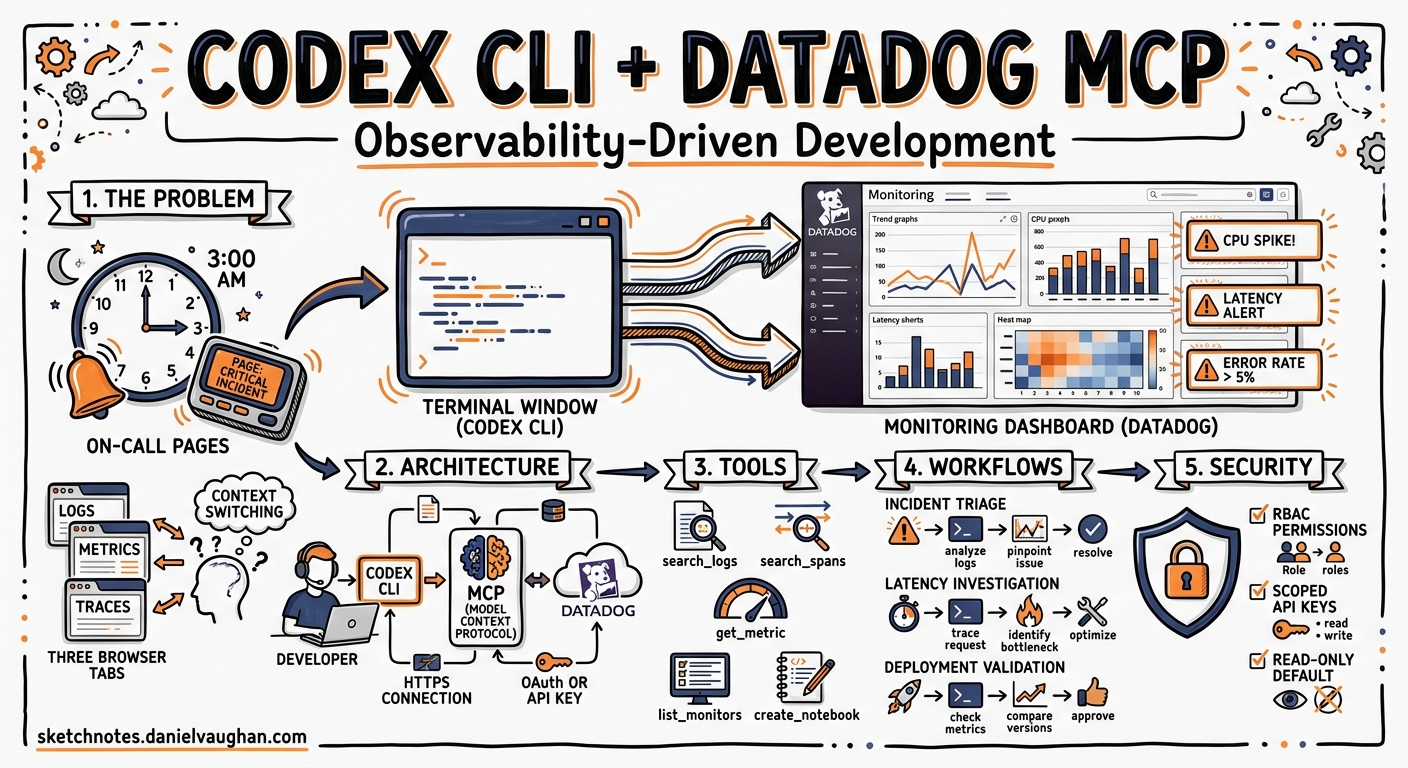
On-call pages arrive at 03:00. You SSH into a jumpbox, open three browser tabs — Datadog dashboards, APM traces, log explorer — and start cross-referencing timestamps by hand. By the time you have found the offending span, the incident channel has escalated twice. That workflow is now obsolete. Since March 2026, Datadog ships a remote MCP server that exposes logs, metrics, traces, monitors, incidents, and more as tool calls any MCP-capable agent can invoke 1. Wire it into Codex CLI and the agent can query your production telemetry, correlate the data, and propose a fix — all inside a single terminal session.
This article walks through the integration end to end: architecture, configuration, toolset selection, security hardening, and three practical workflows that turn observability data into code changes.
Architecture at a Glance
sequenceDiagram
    participant Dev as Developer
    participant Codex as Codex CLI
    participant MCP as Datadog MCP Server
    participant DD as Datadog Platform

    Dev->>Codex: "Investigate high p99 latency on checkout-service"
    Codex->>MCP: search_datadog_spans (service, time range)
    MCP->>DD: API query (APM)
    DD-->>MCP: Span data
    MCP-->>Codex: Structured results
    Codex->>MCP: search_datadog_logs (correlated trace_id)
    MCP->>DD: Log query
    DD-->>MCP: Log entries
    MCP-->>Codex: Structured results
    Codex->>Dev: Root-cause analysis + proposed patch
The Datadog MCP server is a remote, streamable-HTTP endpoint hosted by Datadog [^2]. Codex CLI connects over HTTPS using either OAuth 2.0 or API-key headers — no local sidecar process required. Every tool call maps to a Datadog API query, and the server enforces the same RBAC permissions as the Datadog web application 2.
Prerequisites
| Requirement | Detail |
|---|---|
| Codex CLI | v0.129.0+ (npm install -g @openai/codex@latest) |
| Datadog account | Any paid tier; the MCP server is available on all commercial sites 2 |
| Permissions | mcp_read role for read operations; mcp_write for notebook/dashboard creation 2 |
| Supported sites | app.datadoghq.com, us3, us5, app.datadoghq.eu, ap1, ap2 (GovCloud excluded) 2 |
Configuration
Minimal Setup
Add the server to ~/.codex/config.toml:
[mcp_servers.datadog]
url = "https://app.datadoghq.com/mcp/sse"
Then authenticate via OAuth:
codex mcp login datadog
This opens a browser-based OAuth 2.0 flow. Once complete, Codex stores the token and refreshes it automatically 3.
API-Key Authentication
For headless environments — CI runners, remote devboxes — OAuth is impractical. Use scoped API credentials instead:
[mcp_servers.datadog]
url = "https://app.datadoghq.com/mcp/sse"
env_http_headers = { DD-API-KEY = "DD_API_KEY", DD-APPLICATION-KEY = "DD_APPLICATION_KEY" }
Export the variables from your secrets manager before launching Codex. Use a service account with minimal permissions rather than personal keys 2.
Selecting Toolsets
By default, Codex receives only the core toolset — roughly 22 tools covering logs, metrics, spans, monitors, incidents, dashboards, and hosts 4. You can widen or narrow scope via query parameters on the URL:
# Core + APM + Error Tracking + Software Delivery
[mcp_servers.datadog]
url = "https://app.datadoghq.com/mcp/sse?toolsets=core,apm,error_tracking,software_delivery"
Available toolsets include alerting, apm, cases, dashboards, dbm, ddsql, error_tracking, feature_flags, kubernetes, networks, onboarding, reference_tables, security, software_delivery, synthetics, and workflows 4. Enabling everything (?toolsets=all) is tempting but adds substantial token overhead per turn — each tool definition consumes context window. A pragmatic default for backend engineers:
url = "https://app.datadoghq.com/mcp/sse?toolsets=core,apm,error_tracking,software_delivery"
Hardening with Tool Allow-Lists
Even within a toolset, you may want to restrict which tools the agent can call. Use enabled_tools to create an explicit allow-list 3:
[mcp_servers.datadog]
url = "https://app.datadoghq.com/mcp/sse?toolsets=core,apm"
enabled_tools = [
  "search_datadog_logs",
  "analyze_datadog_logs",
  "search_datadog_spans",
  "get_datadog_trace",
  "search_datadog_monitors",
  "search_datadog_incidents",
  "get_datadog_incident",
  "get_datadog_metric",
]
This prevents the agent from creating dashboards or notebooks unattended — sensible if you run with approval_policy = "unless-allow-listed" 5.
Rate Limits
The Datadog MCP server enforces fair-use limits 2:
| Window | Limit |
|---|---|
| 10-second burst | 50 requests |
| Daily | 5,000 tool calls |
| Monthly | 50,000 tool calls |
For sustained incident investigation these limits are generous, but automated batch scripts calling codex exec in a loop can exhaust the daily budget quickly. Monitor consumption via the datadog.mcp.tool.usage metric emitted by the server itself 2.
Practical Workflows
1. Incident Triage: From Page to Patch
An on-call engineer receives a PagerDuty alert linked to a Datadog monitor. Rather than context-switching to the browser:
codex --approval-mode suggest \
  "Datadog monitor 'checkout-p99-latency' fired 10 minutes ago. \
   Use the Datadog MCP tools to: \
   1. Get the monitor details and current status \
   2. Search APM spans for checkout-service in the last 30 minutes \
   3. Search logs correlated with any slow traces \
   4. Identify the root cause and suggest a fix"
Codex calls search_datadog_monitors, search_datadog_spans, search_datadog_logs, and get_datadog_trace in sequence, correlates trace IDs across the results, and presents a root-cause summary with a proposed code change. The engineer reviews the diff, approves, and the fix ships — all without leaving the terminal.
2. Deploy Verification with CI Pipeline Telemetry
After a deploy, verify that error rates and latency have not regressed:
codex exec "Use Datadog MCP tools to compare the error rate and p99 latency \
  of payment-service for the 30 minutes before and after the deploy at 14:00 UTC today. \
  Output a markdown summary with pass/fail verdict."
With the software_delivery toolset enabled, the agent can also cross-reference CI pipeline events via search_datadog_ci_pipeline_events to link the deploy commit hash to any metric regression 4.
3. Database Slow-Query Investigation
Enable the dbm toolset and point the agent at a sluggish endpoint:
codex "The /api/orders endpoint has degraded to 800ms p95. \
  Use Datadog DBM tools to find the slowest queries hitting the orders database, \
  retrieve their explain plans, and suggest index optimisations."
The agent calls find_datadog_database_instances, get_datadog_database_query_performance, get_datadog_database_explain_plans, and optimize_datadog_database_query to produce actionable index recommendations with the SQL to apply them 4.
Combining with AGENTS.md
Encode your observability workflow standards in your repository’s AGENTS.md:
## Observability

- Before claiming a performance fix is complete, use Datadog MCP tools to verify
  the relevant metric has improved in the last 5 minutes of staging traffic.
- When investigating incidents, always correlate APM traces with logs using
  trace_id before proposing a root cause.
- Never create or modify Datadog dashboards or monitors without human approval.
This ensures that any engineer on the team — or any codex exec CI job — follows the same investigative discipline.
Combining with Hooks
Use a PostToolUse hook to audit every Datadog query the agent makes:
[[hooks]]
event = "PostToolUse"
tool_name_regex = "^(search|get|analyze)_datadog_.*"
command = "echo \"$(date -u +%Y-%m-%dT%H:%M:%SZ) DATADOG_QUERY tool=$CODEX_TOOL_NAME\" >> /var/log/codex-datadog-audit.log"
For write operations, enforce manual approval regardless of the global approval policy:
[[hooks]]
event = "PostToolUse"
tool_name_regex = "^(create|edit|upsert|delete)_datadog_.*"
command = "echo 'BLOCKED: Write operation requires manual approval' && exit 1"
Security Considerations
| Risk | Mitigation |
|---|---|
| Agent exfiltrates production data | Sandbox network policy restricts outbound to Datadog endpoints only; enabled_tools limits read surface 3 5 |
| Credential leakage in session logs | Use bearer_token_env_var or env_http_headers — never inline secrets in config.toml 3 |
| Unintended dashboard/monitor mutation | Restrict to mcp_read role; use enabled_tools to omit write tools; add PostToolUse guard hooks |
| Rate-limit exhaustion | Monitor datadog.mcp.tool.usage metric; set daily budget alerts in Datadog itself 2 |
| HIPAA / compliance | The MCP server is HIPAA-eligible, but verify your AI agent’s data handling meets your compliance requirements 2 |
Known Limitations
- GovCloud not supported. The MCP server is unavailable on
app.ddog-gov.comandus2.ddog-gov.com2. - No streaming results. Large log or span queries return complete result sets; very broad time ranges may hit response-size limits or timeouts.
- Context window cost. Each enabled toolset adds tool definitions to the prompt. Enabling all toolsets can consume 10,000+ tokens before the first user message. Choose toolsets deliberately.
- APM toolset is in preview. Tools like
apm_trace_comparisonandapm_latency_bottleneck_analysismay change or be removed 4. - Usage data retained 120 days. Datadog retains MCP session metadata per its privacy policy 2.
Conclusion
The Datadog MCP server turns Codex CLI into an observability-aware coding agent. Instead of a human manually correlating dashboards, traces, and logs, the agent does the cross-referencing and presents a synthesised diagnosis. The key to making this practical is toolset discipline — enable only what you need, lock down write operations, and encode investigative standards in AGENTS.md. For on-call engineers, the payoff is measured in minutes saved at 03:00.
Citations
| [^2]: Datadog, “MCP Server | AI Agent-Ready Observability,” Datadog Product Page, 2026. https://www.datadoghq.com/product/ai/mcp-server/ |
-
Datadog, “Datadog MCP Server: Connect your AI agents to Datadog tools and context,” Datadog Blog, March 2026. https://www.datadoghq.com/blog/datadog-remote-mcp-server/ ↩
-
Datadog, “Datadog MCP Server — Documentation,” Datadog Docs, 2026. https://docs.datadoghq.com/bits_ai/mcp_server/ ↩ ↩2 ↩3 ↩4 ↩5 ↩6 ↩7 ↩8 ↩9 ↩10 ↩11
-
OpenAI, “Model Context Protocol — Codex CLI,” OpenAI Developers, 2026. https://developers.openai.com/codex/mcp ↩ ↩2 ↩3 ↩4
-
Datadog, “Datadog MCP Server Tools,” Datadog Docs, 2026. https://docs.datadoghq.com/bits_ai/mcp_server/tools/ ↩ ↩2 ↩3 ↩4 ↩5
-
OpenAI, “Agent Approvals & Security — Codex CLI,” OpenAI Developers, 2026. https://developers.openai.com/codex/agent-approvals-security ↩ ↩2